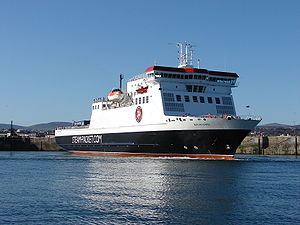
MS Ben-my-Chree

better than riding a car with two passengers
(based on 2020 data)
Often travels on 1 routes
- Douglas [IM] ↔ Heysham [GB] - 104 km
⚠️
Do you know of a route that this ship frequently travels but is not listed? Or have you noticed an error?
Please help by letting us know, thank you 🙇🏽♀️
Please help by letting us know, thank you 🙇🏽♀️
Ship Statistics
| 2022 yearly CO₂ Emissions | |||
|---|---|---|---|
| assigned to | total | average | ratio |
| persons 🙎♀️ | N/A | N/A | N/A |
| freight 🚛 | N/A | N/A | N/A |
| total | N/A | N/A | 100% |
| 2022 yearly statistics | |
|---|---|
| distance travelled | N/A |
| time at sea | N/A |
| 2022 average statistics per journey | |
|---|---|
| average persons transported 🙎♀️ | N/A |
| average freight transported 🚛 | N/A |
| average speed | N/A |
2022 monitoring methods:
N/A
2022 Theoretical
N/A
﹖ details
| 2021 yearly CO₂ Emissions | |||
|---|---|---|---|
| assigned to | total | average | ratio |
| persons 🙎♀️ | N/A | N/A | N/A |
| freight 🚛 | N/A | N/A | N/A |
| total | N/A | N/A | 100% |
| 2021 yearly statistics | |
|---|---|
| distance travelled | N/A |
| time at sea | N/A |
| 2021 average statistics per journey | |
|---|---|
| average persons transported 🙎♀️ | N/A |
| average freight transported 🚛 | N/A |
| average speed | N/A |
2021 monitoring methods:
N/A
2021 Theoretical
N/A
﹖ details
| 2020 yearly CO₂ Emissions | |||
|---|---|---|---|
| assigned to | total | average | ratio |
| persons 🙎♀️ | 1523 tonnes CO₂ | 0.38 g·CO₂/pax/n.mile | 8 % ⚙️ |
| freight 🚛 | 16823 tonnes CO₂ | 0.46 kg·CO₂/m tonne/n.mile | 92 % ⚙️ |
| total | 18345 tonnes CO₂ | 278 kg·CO₂/n.mile | 100% |
| 2020 yearly statistics | |
|---|---|
| distance travelled | 122121 km ⚙️ |
| time at sea | 3893 hours |
| 2020 average statistics per journey | |
|---|---|
| average persons transported 🙎♀️ | 60762 persons ⚙️ |
| average freight transported 🚛 | 554610 metric tons ⚙️ |
| average speed | 31 km/h ⚙️ |
2020 monitoring methods:
N/A
2020 Theoretical
EIV (Efficiency Indicator Values): 63.7 gCO₂/ton/nautical mile
﹖ details
| 2019 yearly CO₂ Emissions | |||
|---|---|---|---|
| assigned to | total | average | ratio |
| persons 🙎♀️ | 7419 tonnes CO₂ | 0.32 g·CO₂/pax/n.mile | 33 % ⚙️ |
| freight 🚛 | 16819 tonnes CO₂ | 0.29 kg·CO₂/m tonne/n.mile | 67 % ⚙️ |
| total | 22800 tonnes CO₂ | 269 kg·CO₂/n.mile | 100% |
| 2019 yearly statistics | |
|---|---|
| distance travelled | 157236 km ⚙️ |
| time at sea | 5111 hours |
| 2019 average statistics per journey | |
|---|---|
| average persons transported 🙎♀️ | 273085 persons ⚙️ |
| average freight transported 🚛 | 683096 metric tons ⚙️ |
| average speed | 31 km/h ⚙️ |
2019 monitoring methods:
N/A
2019 Theoretical
EIV (Efficiency Indicator Values): 63.7 gCO₂/ton/nautical mile
﹖ details
| 2018 yearly CO₂ Emissions | |||
|---|---|---|---|
| assigned to | total | average | ratio |
| persons 🙎♀️ | 23280 tonnes CO₂ | 1 g·CO₂/pax/n.mile | 100 % ⚙️ |
| freight 🚛 | 23280 tonnes CO₂ | 0.42 kg·CO₂/m tonne/n.mile | N/A |
| total | 23280 tonnes CO₂ | 293 kg·CO₂/n.mile | 100% |
| 2018 yearly statistics | |
|---|---|
| distance travelled | 147093 km ⚙️ |
| time at sea | 4548 hours |
| 2018 average statistics per journey | |
|---|---|
| average persons transported 🙎♀️ | 254878 persons ⚙️ |
| average freight transported 🚛 | 697881 metric tons ⚙️ |
| average speed | 32 km/h ⚙️ |
2018 monitoring methods:
N/A
2018 Theoretical
EIV (Efficiency Indicator Values): 63.7 gCO₂/ton/nautical mile
﹖ details
ℹ️
Figures with the icon ⚙️ were computed based on the published data.
You can find computation details on
this page ↗
GreenFerries is a hobby project, all the data shown here has no official value. It is Open Source, so you can double check and modify it.

The Ecoscore compares
average CO₂ emissions per passenger per km.
‟emits like 2.1 planes” means that the ferry emits more than twice what an average plane would on the same distance for one passenger.