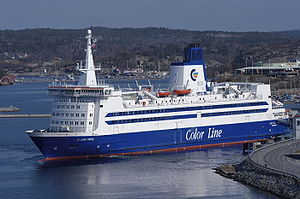
MS Color Viking

2 to 4 times an average plane's emissions
(based on 2021 data)
Often travels on 0 routes
⚠️
Do you know of a route that this ship frequently travels but is not listed? Or have you noticed an error?
Please help by letting us know, thank you 🙇🏽♀️
Please help by letting us know, thank you 🙇🏽♀️
Ship Statistics
| 2022 yearly CO₂ Emissions | |||
|---|---|---|---|
| assigned to | total | average | ratio |
| persons 🙎♀️ | N/A | N/A | N/A |
| freight 🚛 | N/A | N/A | N/A |
| total | N/A | N/A | 100% |
| 2022 yearly statistics | |
|---|---|
| distance travelled | N/A |
| time at sea | N/A |
| 2022 average statistics per journey | |
|---|---|
| average persons transported 🙎♀️ | N/A |
| average freight transported 🚛 | N/A |
| average speed | N/A |
2022 monitoring methods:
N/A
2022 Theoretical
N/A
﹖ details
| 2021 yearly CO₂ Emissions | |||
|---|---|---|---|
| assigned to | total | average | ratio |
| persons 🙎♀️ | 2707 tonnes CO₂ | 726 g·CO₂/pax/n.mile | 97 % ⚙️ |
| freight 🚛 | 81 tonnes CO₂ | 52 kg·CO₂/m tonne/n.mile | 3 % ⚙️ |
| total | 2787 tonnes CO₂ | 425 kg·CO₂/n.mile | 100% |
| 2021 yearly statistics | |
|---|---|
| distance travelled | 12134 km ⚙️ |
| time at sea | 460 hours |
| 2021 average statistics per journey | |
|---|---|
| average persons transported 🙎♀️ | 569 persons ⚙️ |
| average freight transported 🚛 | 239 metric tons ⚙️ |
| average speed | 26 km/h ⚙️ |
2021 monitoring methods:
N/A
2021 Theoretical
EIV (Efficiency Indicator Values): 45.6 gCO₂/ton/nautical mile
﹖ details
| 2020 yearly CO₂ Emissions | |||
|---|---|---|---|
| assigned to | total | average | ratio |
| persons 🙎♀️ | 4684 tonnes CO₂ | 2757 g·CO₂/pax/n.mile | 95 % ⚙️ |
| freight 🚛 | 247 tonnes CO₂ | 116 kg·CO₂/m tonne/n.mile | 5 % ⚙️ |
| total | 4931 tonnes CO₂ | 640 kg·CO₂/n.mile | 100% |
| 2020 yearly statistics | |
|---|---|
| distance travelled | 14268 km ⚙️ |
| time at sea | 535 hours |
| 2020 average statistics per journey | |
|---|---|
| average persons transported 🙎♀️ | 221 persons ⚙️ |
| average freight transported 🚛 | 276 metric tons ⚙️ |
| average speed | 27 km/h ⚙️ |
2020 monitoring methods:
N/A
2020 Theoretical
EIV (Efficiency Indicator Values): 45.6 gCO₂/ton/nautical mile
﹖ details
| 2019 yearly CO₂ Emissions | |||
|---|---|---|---|
| assigned to | total | average | ratio |
| persons 🙎♀️ | 17314 tonnes CO₂ | 908 g·CO₂/pax/n.mile | 82 % ⚙️ |
| freight 🚛 | 3801 tonnes CO₂ | 255 kg·CO₂/m tonne/n.mile | 18 % ⚙️ |
| total | 21115 tonnes CO₂ | 428 kg·CO₂/n.mile | 100% |
| 2019 yearly statistics | |
|---|---|
| distance travelled | 91356 km ⚙️ |
| time at sea | 3429 hours |
| 2019 average statistics per journey | |
|---|---|
| average persons transported 🙎♀️ | 387 persons ⚙️ |
| average freight transported 🚛 | 303 metric tons ⚙️ |
| average speed | 27 km/h ⚙️ |
2019 monitoring methods:
N/A
2019 Theoretical
EIV (Efficiency Indicator Values): 45.6 gCO₂/ton/nautical mile
﹖ details
| 2018 yearly CO₂ Emissions | |||
|---|---|---|---|
| assigned to | total | average | ratio |
| persons 🙎♀️ | 16038 tonnes CO₂ | 768 g·CO₂/pax/n.mile | 82 % ⚙️ |
| freight 🚛 | 3520 tonnes CO₂ | 234 kg·CO₂/m tonne/n.mile | 18 % ⚙️ |
| total | 19558 tonnes CO₂ | 395 kg·CO₂/n.mile | 100% |
| 2018 yearly statistics | |
|---|---|
| distance travelled | 91624 km ⚙️ |
| time at sea | 3802 hours |
| 2018 average statistics per journey | |
|---|---|
| average persons transported 🙎♀️ | 422 persons ⚙️ |
| average freight transported 🚛 | 304 metric tons ⚙️ |
| average speed | 24 km/h ⚙️ |
2018 monitoring methods:
N/A
2018 Theoretical
EIV (Efficiency Indicator Values): 137 gCO₂/ton/nautical mile
﹖ details
ℹ️
Figures with the icon ⚙️ were computed based on the published data.
You can find computation details on
this page ↗
GreenFerries is a hobby project, all the data shown here has no official value. It is Open Source, so you can double check and modify it.

The Ecoscore compares
average CO₂ emissions per passenger per km.
‟emits like 2.1 planes” means that the ferry emits more than twice what an average plane would on the same distance for one passenger.