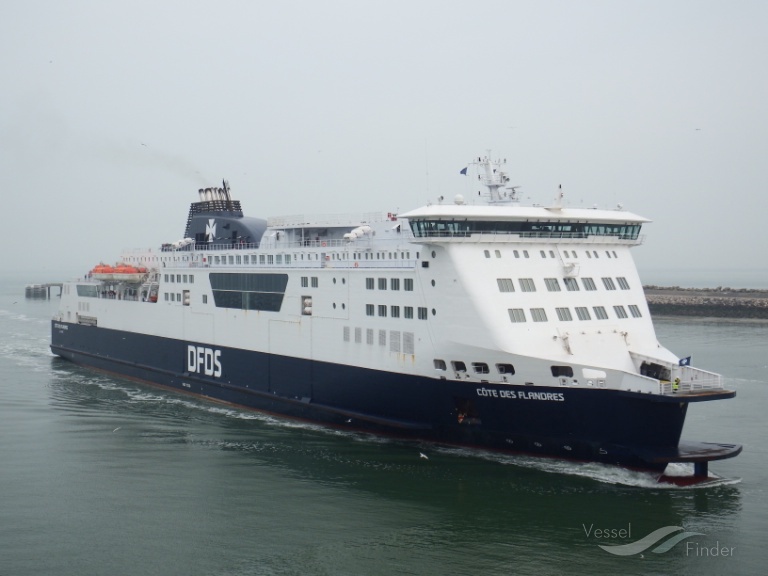
MS Côte des Flandres

over 4 times an average plane's emissions
(based on 2022 data)
Often travels on 1 routes
- Dover [GB] ↔ Calais [FR] - 42 km
⚠️
Do you know of a route that this ship frequently travels but is not listed? Or have you noticed an error?
Please help by letting us know, thank you 🙇🏽♀️
Please help by letting us know, thank you 🙇🏽♀️
Ship Statistics
| 2022 yearly CO₂ Emissions | |||
|---|---|---|---|
| assigned to | total | average | ratio |
| persons 🙎♀️ | 16706 tonnes CO₂ | 1274 g·CO₂/pax/n.mile | 41 % ⚙️ |
| freight 🚛 | 24040 tonnes CO₂ | 226 kg·CO₂/m tonne/n.mile | 59 % ⚙️ |
| total | 40746 tonnes CO₂ | 568 kg·CO₂/n.mile | 100% |
| 2022 yearly statistics | |
|---|---|
| distance travelled | 132749 km ⚙️ |
| time at sea | 4676 hours |
| 2022 average statistics per journey | |
|---|---|
| average persons transported 🙎♀️ | 183 persons ⚙️ |
| average freight transported 🚛 | 1486 metric tons ⚙️ |
| average speed | 28 km/h ⚙️ |
2022 monitoring methods:
N/A
2022 Theoretical
EIV (Efficiency Indicator Values): 26.8 gCO₂/ton/nautical mile
﹖ details
| 2021 yearly CO₂ Emissions | |||
|---|---|---|---|
| assigned to | total | average | ratio |
| persons 🙎♀️ | 16804 tonnes CO₂ | 37 g·CO₂/pax/n.mile | 41 % ⚙️ |
| freight 🚛 | 24181 tonnes CO₂ | 3 kg·CO₂/m tonne/n.mile | 59 % ⚙️ |
| total | 40986 tonnes CO₂ | 543 kg·CO₂/n.mile | 100% |
| 2021 yearly statistics | |
|---|---|
| distance travelled | 139886 km ⚙️ |
| time at sea | 5328 hours |
| 2021 average statistics per journey | |
|---|---|
| average persons transported 🙎♀️ | 5945 persons ⚙️ |
| average freight transported 🚛 | 97605 metric tons ⚙️ |
| average speed | 26 km/h ⚙️ |
2021 monitoring methods:
N/A
2021 Theoretical
EIV (Efficiency Indicator Values): 4.86 gCO₂/ton/nautical mile
﹖ details
| 2020 yearly CO₂ Emissions | |||
|---|---|---|---|
| assigned to | total | average | ratio |
| persons 🙎♀️ | 17016 tonnes CO₂ | 1741 g·CO₂/pax/n.mile | 41 % ⚙️ |
| freight 🚛 | 24487 tonnes CO₂ | 198 kg·CO₂/m tonne/n.mile | 59 % ⚙️ |
| total | 41503 tonnes CO₂ | 583 kg·CO₂/n.mile | 100% |
| 2020 yearly statistics | |
|---|---|
| distance travelled | 131733 km ⚙️ |
| time at sea | 5075 hours |
| 2020 average statistics per journey | |
|---|---|
| average persons transported 🙎♀️ | 137 persons ⚙️ |
| average freight transported 🚛 | 1739 metric tons ⚙️ |
| average speed | 26 km/h ⚙️ |
2020 monitoring methods:
N/A
2020 Theoretical
EIV (Efficiency Indicator Values): 4.86 gCO₂/ton/nautical mile
﹖ details
| 2019 yearly CO₂ Emissions | |||
|---|---|---|---|
| assigned to | total | average | ratio |
| persons 🙎♀️ | 18117 tonnes CO₂ | 948 g·CO₂/pax/n.mile | 41 % ⚙️ |
| freight 🚛 | 26070 tonnes CO₂ | 188 kg·CO₂/m tonne/n.mile | 59 % ⚙️ |
| total | 44187 tonnes CO₂ | 594 kg·CO₂/n.mile | 100% |
| 2019 yearly statistics | |
|---|---|
| distance travelled | 137878 km ⚙️ |
| time at sea | 5130 hours |
| 2019 average statistics per journey | |
|---|---|
| average persons transported 🙎♀️ | 257 persons ⚙️ |
| average freight transported 🚛 | 1860 metric tons ⚙️ |
| average speed | 27 km/h ⚙️ |
2019 monitoring methods:
N/A
2019 Theoretical
EIV (Efficiency Indicator Values): 4.86 gCO₂/ton/nautical mile
﹖ details
| 2018 yearly CO₂ Emissions | |||
|---|---|---|---|
| assigned to | total | average | ratio |
| persons 🙎♀️ | 54235 tonnes CO₂ | 2862 g·CO₂/pax/n.mile | 100 % ⚙️ |
| freight 🚛 | 54235 tonnes CO₂ | N/A | N/A |
| total | 54235 tonnes CO₂ | 686 kg·CO₂/n.mile | 100% |
| 2018 yearly statistics | |
|---|---|
| distance travelled | 146446 km ⚙️ |
| time at sea | 5449 hours |
| 2018 average statistics per journey | |
|---|---|
| average persons transported 🙎♀️ | 240 persons ⚙️ |
| average freight transported 🚛 | N/A |
| average speed | 27 km/h ⚙️ |
2018 monitoring methods:
N/A
2018 Theoretical
EIV (Efficiency Indicator Values): 4.86 gCO₂/ton/nautical mile
﹖ details
ℹ️
Figures with the icon ⚙️ were computed based on the published data.
You can find computation details on
this page ↗
GreenFerries is a hobby project, all the data shown here has no official value. It is Open Source, so you can double check and modify it.

The Ecoscore compares
average CO₂ emissions per passenger per km.
‟emits like 2.1 planes” means that the ferry emits more than twice what an average plane would on the same distance for one passenger.