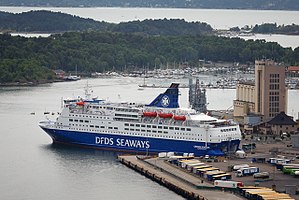
MS Crown Seaways

better than riding a car with a single passenger
(based on 2022 data)
Often travels on 1 routes
- Copenhague [DK] ↔ Oslo [NO] - 483 km
⚠️
Do you know of a route that this ship frequently travels but is not listed? Or have you noticed an error?
Please help by letting us know, thank you 🙇🏽♀️
Please help by letting us know, thank you 🙇🏽♀️
Ship Statistics
| 2022 yearly CO₂ Emissions | |||
|---|---|---|---|
| assigned to | total | average | ratio |
| persons 🙎♀️ | 31788 tonnes CO₂ | 356 g·CO₂/pax/n.mile | 64 % ⚙️ |
| freight 🚛 | 17881 tonnes CO₂ | 531 kg·CO₂/m tonne/n.mile | 36 % ⚙️ |
| total | 49669 tonnes CO₂ | 487 kg·CO₂/n.mile | 100% |
| 2022 yearly statistics | |
|---|---|
| distance travelled | 189065 km ⚙️ |
| time at sea | 6337 hours |
| 2022 average statistics per journey | |
|---|---|
| average persons transported 🙎♀️ | 875 persons ⚙️ |
| average freight transported 🚛 | 330 metric tons ⚙️ |
| average speed | 30 km/h ⚙️ |
2022 monitoring methods:
N/A
2022 Theoretical
EIV (Efficiency Indicator Values): 26.21 gCO₂/ton/nautical mile
﹖ details
| 2021 yearly CO₂ Emissions | |||
|---|---|---|---|
| assigned to | total | average | ratio |
| persons 🙎♀️ | 16961 tonnes CO₂ | 734 g·CO₂/pax/n.mile | 64 % ⚙️ |
| freight 🚛 | 9540 tonnes CO₂ | 639 kg·CO₂/m tonne/n.mile | 36 % ⚙️ |
| total | 26501 tonnes CO₂ | 485 kg·CO₂/n.mile | 100% |
| 2021 yearly statistics | |
|---|---|
| distance travelled | 101125 km ⚙️ |
| time at sea | 3370 hours |
| 2021 average statistics per journey | |
|---|---|
| average persons transported 🙎♀️ | 423 persons ⚙️ |
| average freight transported 🚛 | 273 metric tons ⚙️ |
| average speed | 30 km/h ⚙️ |
2021 monitoring methods:
N/A
2021 Theoretical
EIV (Efficiency Indicator Values): 4.04 gCO₂/ton/nautical mile
﹖ details
| 2020 yearly CO₂ Emissions | |||
|---|---|---|---|
| assigned to | total | average | ratio |
| persons 🙎♀️ | 16963 tonnes CO₂ | 707 g·CO₂/pax/n.mile | 64 % ⚙️ |
| freight 🚛 | 9542 tonnes CO₂ | 486 kg·CO₂/m tonne/n.mile | 36 % ⚙️ |
| total | 26505 tonnes CO₂ | 504 kg·CO₂/n.mile | 100% |
| 2020 yearly statistics | |
|---|---|
| distance travelled | 97444 km ⚙️ |
| time at sea | 3336 hours |
| 2020 average statistics per journey | |
|---|---|
| average persons transported 🙎♀️ | 456 persons ⚙️ |
| average freight transported 🚛 | 373 metric tons ⚙️ |
| average speed | 29 km/h ⚙️ |
2020 monitoring methods:
N/A
2020 Theoretical
EIV (Efficiency Indicator Values): 4.04 gCO₂/ton/nautical mile
﹖ details
| 2019 yearly CO₂ Emissions | |||
|---|---|---|---|
| assigned to | total | average | ratio |
| persons 🙎♀️ | 29027 tonnes CO₂ | 263 g·CO₂/pax/n.mile | 64 % ⚙️ |
| freight 🚛 | 16328 tonnes CO₂ | 269 kg·CO₂/m tonne/n.mile | 36 % ⚙️ |
| total | 45354 tonnes CO₂ | 457 kg·CO₂/n.mile | 100% |
| 2019 yearly statistics | |
|---|---|
| distance travelled | 183824 km ⚙️ |
| time at sea | 6289 hours |
| 2019 average statistics per journey | |
|---|---|
| average persons transported 🙎♀️ | 1113 persons ⚙️ |
| average freight transported 🚛 | 611 metric tons ⚙️ |
| average speed | 29 km/h ⚙️ |
2019 monitoring methods:
N/A
2019 Theoretical
EIV (Efficiency Indicator Values): 4.04 gCO₂/ton/nautical mile
﹖ details
| 2018 yearly CO₂ Emissions | |||
|---|---|---|---|
| assigned to | total | average | ratio |
| persons 🙎♀️ | 42642 tonnes CO₂ | 426 g·CO₂/pax/n.mile | 100 % ⚙️ |
| freight 🚛 | 42642 tonnes CO₂ | N/A | N/A |
| total | 42642 tonnes CO₂ | 461 kg·CO₂/n.mile | 100% |
| 2018 yearly statistics | |
|---|---|
| distance travelled | 171240 km ⚙️ |
| time at sea | 5869 hours |
| 2018 average statistics per journey | |
|---|---|
| average persons transported 🙎♀️ | 1082 persons ⚙️ |
| average freight transported 🚛 | N/A |
| average speed | 29 km/h ⚙️ |
2018 monitoring methods:
N/A
2018 Theoretical
EIV (Efficiency Indicator Values): 4.04 gCO₂/ton/nautical mile
﹖ details
ℹ️
Figures with the icon ⚙️ were computed based on the published data.
You can find computation details on
this page ↗
GreenFerries is a hobby project, all the data shown here has no official value. It is Open Source, so you can double check and modify it.

The Ecoscore compares
average CO₂ emissions per passenger per km.
‟emits like 2.1 planes” means that the ferry emits more than twice what an average plane would on the same distance for one passenger.