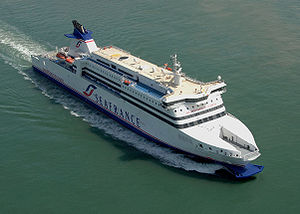
MS Dieppe Seaways

1 to 2 times an average plane's emissions
(based on 2022 data)
Often travels on 1 routes
- Cherbourg [FR] ↔ Rosslare [IE] - 444 km
⚠️
Do you know of a route that this ship frequently travels but is not listed? Or have you noticed an error?
Please help by letting us know, thank you 🙇🏽♀️
Please help by letting us know, thank you 🙇🏽♀️
Ship Statistics
| 2022 yearly CO₂ Emissions | |||
|---|---|---|---|
| assigned to | total | average | ratio |
| persons 🙎♀️ | 9610 tonnes CO₂ | 429 g·CO₂/pax/n.mile | 24 % ⚙️ |
| freight 🚛 | 25102 tonnes CO₂ | 352 kg·CO₂/m tonne/n.mile | 76 % ⚙️ |
| total | 40416 tonnes CO₂ | 626 kg·CO₂/n.mile | 100% |
| 2022 yearly statistics | |
|---|---|
| distance travelled | 119577 km ⚙️ |
| time at sea | 4019 hours |
| 2022 average statistics per journey | |
|---|---|
| average persons transported 🙎♀️ | 347 persons ⚙️ |
| average freight transported 🚛 | 1104 metric tons ⚙️ |
| average speed | 30 km/h ⚙️ |
2022 monitoring methods:
N/A
2022 Theoretical
EIV (Efficiency Indicator Values): 24.01 gCO₂/ton/nautical mile
﹖ details
| 2021 yearly CO₂ Emissions | |||
|---|---|---|---|
| assigned to | total | average | ratio |
| persons 🙎♀️ | 7762 tonnes CO₂ | 419 g·CO₂/pax/n.mile | 18 % ⚙️ |
| freight 🚛 | 28857 tonnes CO₂ | 367 kg·CO₂/m tonne/n.mile | 82 % ⚙️ |
| total | 43214 tonnes CO₂ | 643 kg·CO₂/n.mile | 100% |
| 2021 yearly statistics | |
|---|---|
| distance travelled | 124377 km ⚙️ |
| time at sea | 4152 hours |
| 2021 average statistics per journey | |
|---|---|
| average persons transported 🙎♀️ | 276 persons ⚙️ |
| average freight transported 🚛 | 1172 metric tons ⚙️ |
| average speed | 30 km/h ⚙️ |
2021 monitoring methods:
N/A
2021 Theoretical
EIV (Efficiency Indicator Values): 24.01 gCO₂/ton/nautical mile
﹖ details
| 2020 yearly CO₂ Emissions | |||
|---|---|---|---|
| assigned to | total | average | ratio |
| persons 🙎♀️ | 15355 tonnes CO₂ | 1205 g·CO₂/pax/n.mile | 43 % ⚙️ |
| freight 🚛 | 15582 tonnes CO₂ | 290 kg·CO₂/m tonne/n.mile | 57 % ⚙️ |
| total | 35727 tonnes CO₂ | 629 kg·CO₂/n.mile | 100% |
| 2020 yearly statistics | |
|---|---|
| distance travelled | 105154 km ⚙️ |
| time at sea | 3313 hours |
| 2020 average statistics per journey | |
|---|---|
| average persons transported 🙎♀️ | 224 persons ⚙️ |
| average freight transported 🚛 | 947 metric tons ⚙️ |
| average speed | 32 km/h ⚙️ |
2020 monitoring methods:
N/A
2020 Theoretical
EIV (Efficiency Indicator Values): 21.1 gCO₂/ton/nautical mile
﹖ details
| 2019 yearly CO₂ Emissions | |||
|---|---|---|---|
| assigned to | total | average | ratio |
| persons 🙎♀️ | 25380 tonnes CO₂ | 957 g·CO₂/pax/n.mile | 46 % ⚙️ |
| freight 🚛 | 24503 tonnes CO₂ | 158 kg·CO₂/m tonne/n.mile | 54 % ⚙️ |
| total | 55608 tonnes CO₂ | 674 kg·CO₂/n.mile | 100% |
| 2019 yearly statistics | |
|---|---|
| distance travelled | 152745 km ⚙️ |
| time at sea | 5170 hours |
| 2019 average statistics per journey | |
|---|---|
| average persons transported 🙎♀️ | 322 persons ⚙️ |
| average freight transported 🚛 | 1880 metric tons ⚙️ |
| average speed | 30 km/h ⚙️ |
2019 monitoring methods:
N/A
2019 Theoretical
N/A
﹖ details
| 2018 yearly CO₂ Emissions | |||
|---|---|---|---|
| assigned to | total | average | ratio |
| persons 🙎♀️ | 33749 tonnes CO₂ | 1168 g·CO₂/pax/n.mile | 59 % ⚙️ |
| freight 🚛 | 23587 tonnes CO₂ | 213 kg·CO₂/m tonne/n.mile | 41 % ⚙️ |
| total | 57336 tonnes CO₂ | 678 kg·CO₂/n.mile | 100% |
| 2018 yearly statistics | |
|---|---|
| distance travelled | 156576 km ⚙️ |
| time at sea | 5431 hours |
| 2018 average statistics per journey | |
|---|---|
| average persons transported 🙎♀️ | 342 persons ⚙️ |
| average freight transported 🚛 | 1308 metric tons ⚙️ |
| average speed | 29 km/h ⚙️ |
2018 monitoring methods:
N/A
2018 Theoretical
N/A
﹖ details
ℹ️
Figures with the icon ⚙️ were computed based on the published data.
You can find computation details on
this page ↗
GreenFerries is a hobby project, all the data shown here has no official value. It is Open Source, so you can double check and modify it.

The Ecoscore compares
average CO₂ emissions per passenger per km.
‟emits like 2.1 planes” means that the ferry emits more than twice what an average plane would on the same distance for one passenger.