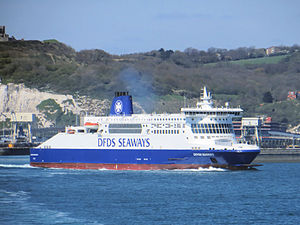
MS Dover Seaways

2 to 4 times an average plane's emissions
(based on 2022 data)
Often travels on 1 routes
- Dunkirk [FR] ↔ Dover [GB] - 75 km
⚠️
Do you know of a route that this ship frequently travels but is not listed? Or have you noticed an error?
Please help by letting us know, thank you 🙇🏽♀️
Please help by letting us know, thank you 🙇🏽♀️
Ship Statistics
| 2022 yearly CO₂ Emissions | |||
|---|---|---|---|
| assigned to | total | average | ratio |
| persons 🙎♀️ | 12838 tonnes CO₂ | 821 g·CO₂/pax/n.mile | 28 % ⚙️ |
| freight 🚛 | 33013 tonnes CO₂ | 278 kg·CO₂/m tonne/n.mile | 72 % ⚙️ |
| total | 45851 tonnes CO₂ | 534 kg·CO₂/n.mile | 100% |
| 2022 yearly statistics | |
|---|---|
| distance travelled | 159065 km ⚙️ |
| time at sea | 4880 hours |
| 2022 average statistics per journey | |
|---|---|
| average persons transported 🙎♀️ | 182 persons ⚙️ |
| average freight transported 🚛 | 1385 metric tons ⚙️ |
| average speed | 33 km/h ⚙️ |
2022 monitoring methods:
N/A
2022 Theoretical
EIV (Efficiency Indicator Values): 27.83 gCO₂/ton/nautical mile
﹖ details
| 2021 yearly CO₂ Emissions | |||
|---|---|---|---|
| assigned to | total | average | ratio |
| persons 🙎♀️ | 14208 tonnes CO₂ | 33 g·CO₂/pax/n.mile | 28 % ⚙️ |
| freight 🚛 | 36534 tonnes CO₂ | 5 kg·CO₂/m tonne/n.mile | 72 % ⚙️ |
| total | 50742 tonnes CO₂ | 558 kg·CO₂/n.mile | 100% |
| 2021 yearly statistics | |
|---|---|
| distance travelled | 168347 km ⚙️ |
| time at sea | 5937 hours |
| 2021 average statistics per journey | |
|---|---|
| average persons transported 🙎♀️ | 4687 persons ⚙️ |
| average freight transported 🚛 | 80384 metric tons ⚙️ |
| average speed | 28 km/h ⚙️ |
2021 monitoring methods:
N/A
2021 Theoretical
EIV (Efficiency Indicator Values): 3.82 gCO₂/ton/nautical mile
﹖ details
| 2020 yearly CO₂ Emissions | |||
|---|---|---|---|
| assigned to | total | average | ratio |
| persons 🙎♀️ | 15079 tonnes CO₂ | 1147 g·CO₂/pax/n.mile | 28 % ⚙️ |
| freight 🚛 | 38774 tonnes CO₂ | 226 kg·CO₂/m tonne/n.mile | 72 % ⚙️ |
| total | 53853 tonnes CO₂ | 607 kg·CO₂/n.mile | 100% |
| 2020 yearly statistics | |
|---|---|
| distance travelled | 164413 km ⚙️ |
| time at sea | 5587 hours |
| 2020 average statistics per journey | |
|---|---|
| average persons transported 🙎♀️ | 148 persons ⚙️ |
| average freight transported 🚛 | 1936 metric tons ⚙️ |
| average speed | 29 km/h ⚙️ |
2020 monitoring methods:
N/A
2020 Theoretical
EIV (Efficiency Indicator Values): 3.82 gCO₂/ton/nautical mile
﹖ details
| 2019 yearly CO₂ Emissions | |||
|---|---|---|---|
| assigned to | total | average | ratio |
| persons 🙎♀️ | 17874 tonnes CO₂ | 609 g·CO₂/pax/n.mile | 28 % ⚙️ |
| freight 🚛 | 45961 tonnes CO₂ | 250 kg·CO₂/m tonne/n.mile | 72 % ⚙️ |
| total | 63835 tonnes CO₂ | 667 kg·CO₂/n.mile | 100% |
| 2019 yearly statistics | |
|---|---|
| distance travelled | 177148 km ⚙️ |
| time at sea | 5918 hours |
| 2019 average statistics per journey | |
|---|---|
| average persons transported 🙎♀️ | 307 persons ⚙️ |
| average freight transported 🚛 | 1925 metric tons ⚙️ |
| average speed | 30 km/h ⚙️ |
2019 monitoring methods:
N/A
2019 Theoretical
EIV (Efficiency Indicator Values): 3.82 gCO₂/ton/nautical mile
﹖ details
| 2018 yearly CO₂ Emissions | |||
|---|---|---|---|
| assigned to | total | average | ratio |
| persons 🙎♀️ | 59132 tonnes CO₂ | 1882 g·CO₂/pax/n.mile | 100 % ⚙️ |
| freight 🚛 | 59132 tonnes CO₂ | N/A | -0.00001691138855619556 % ⚙️ |
| total | 59132 tonnes CO₂ | 617 kg·CO₂/n.mile | 100% |
| 2018 yearly statistics | |
|---|---|
| distance travelled | 177480 km ⚙️ |
| time at sea | 5917 hours |
| 2018 average statistics per journey | |
|---|---|
| average persons transported 🙎♀️ | 328 persons ⚙️ |
| average freight transported 🚛 | N/A |
| average speed | 30 km/h ⚙️ |
2018 monitoring methods:
N/A
2018 Theoretical
EIV (Efficiency Indicator Values): 3.82 gCO₂/ton/nautical mile
﹖ details
ℹ️
Figures with the icon ⚙️ were computed based on the published data.
You can find computation details on
this page ↗
GreenFerries is a hobby project, all the data shown here has no official value. It is Open Source, so you can double check and modify it.

The Ecoscore compares
average CO₂ emissions per passenger per km.
‟emits like 2.1 planes” means that the ferry emits more than twice what an average plane would on the same distance for one passenger.