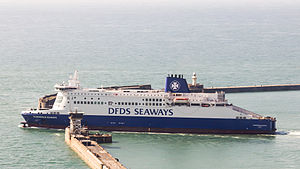
MS Dunkerque Seaways

2 to 4 times an average plane's emissions
(based on 2022 data)
Often travels on 1 routes
- Dunkirk [FR] ↔ Dover [GB] - 75 km
⚠️
Do you know of a route that this ship frequently travels but is not listed? Or have you noticed an error?
Please help by letting us know, thank you 🙇🏽♀️
Please help by letting us know, thank you 🙇🏽♀️
Ship Statistics
| 2022 yearly CO₂ Emissions | |||
|---|---|---|---|
| assigned to | total | average | ratio |
| persons 🙎♀️ | 13429 tonnes CO₂ | 864 g·CO₂/pax/n.mile | 28 % ⚙️ |
| freight 🚛 | 34531 tonnes CO₂ | 275 kg·CO₂/m tonne/n.mile | 72 % ⚙️ |
| total | 47960 tonnes CO₂ | 553 kg·CO₂/n.mile | 100% |
| 2022 yearly statistics | |
|---|---|
| distance travelled | 160564 km ⚙️ |
| time at sea | 4926 hours |
| 2022 average statistics per journey | |
|---|---|
| average persons transported 🙎♀️ | 179 persons ⚙️ |
| average freight transported 🚛 | 1451 metric tons ⚙️ |
| average speed | 33 km/h ⚙️ |
2022 monitoring methods:
N/A
2022 Theoretical
EIV (Efficiency Indicator Values): 27.83 gCO₂/ton/nautical mile
﹖ details
| 2021 yearly CO₂ Emissions | |||
|---|---|---|---|
| assigned to | total | average | ratio |
| persons 🙎♀️ | 14115 tonnes CO₂ | 33 g·CO₂/pax/n.mile | 28 % ⚙️ |
| freight 🚛 | 36296 tonnes CO₂ | 5 kg·CO₂/m tonne/n.mile | 72 % ⚙️ |
| total | 50411 tonnes CO₂ | 543 kg·CO₂/n.mile | 100% |
| 2021 yearly statistics | |
|---|---|
| distance travelled | 171946 km ⚙️ |
| time at sea | 6009 hours |
| 2021 average statistics per journey | |
|---|---|
| average persons transported 🙎♀️ | 4655 persons ⚙️ |
| average freight transported 🚛 | 80275 metric tons ⚙️ |
| average speed | 29 km/h ⚙️ |
2021 monitoring methods:
N/A
2021 Theoretical
EIV (Efficiency Indicator Values): 3.44 gCO₂/ton/nautical mile
﹖ details
| 2020 yearly CO₂ Emissions | |||
|---|---|---|---|
| assigned to | total | average | ratio |
| persons 🙎♀️ | 14352 tonnes CO₂ | 1127 g·CO₂/pax/n.mile | 28 % ⚙️ |
| freight 🚛 | 36904 tonnes CO₂ | 218 kg·CO₂/m tonne/n.mile | 72 % ⚙️ |
| total | 51256 tonnes CO₂ | 580 kg·CO₂/n.mile | 100% |
| 2020 yearly statistics | |
|---|---|
| distance travelled | 163637 km ⚙️ |
| time at sea | 5555 hours |
| 2020 average statistics per journey | |
|---|---|
| average persons transported 🙎♀️ | 144 persons ⚙️ |
| average freight transported 🚛 | 1919 metric tons ⚙️ |
| average speed | 29 km/h ⚙️ |
2020 monitoring methods:
N/A
2020 Theoretical
EIV (Efficiency Indicator Values): 3.44 gCO₂/ton/nautical mile
﹖ details
| 2019 yearly CO₂ Emissions | |||
|---|---|---|---|
| assigned to | total | average | ratio |
| persons 🙎♀️ | 16169 tonnes CO₂ | 533 g·CO₂/pax/n.mile | 28 % ⚙️ |
| freight 🚛 | 41578 tonnes CO₂ | 198 kg·CO₂/m tonne/n.mile | 72 % ⚙️ |
| total | 57747 tonnes CO₂ | 629 kg·CO₂/n.mile | 100% |
| 2019 yearly statistics | |
|---|---|
| distance travelled | 170066 km ⚙️ |
| time at sea | 5733 hours |
| 2019 average statistics per journey | |
|---|---|
| average persons transported 🙎♀️ | 330 persons ⚙️ |
| average freight transported 🚛 | 2284 metric tons ⚙️ |
| average speed | 30 km/h ⚙️ |
2019 monitoring methods:
N/A
2019 Theoretical
EIV (Efficiency Indicator Values): 3.44 gCO₂/ton/nautical mile
﹖ details
| 2018 yearly CO₂ Emissions | |||
|---|---|---|---|
| assigned to | total | average | ratio |
| persons 🙎♀️ | 56951 tonnes CO₂ | 1808 g·CO₂/pax/n.mile | 100 % ⚙️ |
| freight 🚛 | 56951 tonnes CO₂ | N/A | N/A |
| total | 56951 tonnes CO₂ | 599 kg·CO₂/n.mile | 100% |
| 2018 yearly statistics | |
|---|---|
| distance travelled | 176014 km ⚙️ |
| time at sea | 5897 hours |
| 2018 average statistics per journey | |
|---|---|
| average persons transported 🙎♀️ | 331 persons ⚙️ |
| average freight transported 🚛 | N/A |
| average speed | 30 km/h ⚙️ |
2018 monitoring methods:
N/A
2018 Theoretical
EIV (Efficiency Indicator Values): 3.44 gCO₂/ton/nautical mile
﹖ details
ℹ️
Figures with the icon ⚙️ were computed based on the published data.
You can find computation details on
this page ↗
GreenFerries is a hobby project, all the data shown here has no official value. It is Open Source, so you can double check and modify it.

The Ecoscore compares
average CO₂ emissions per passenger per km.
‟emits like 2.1 planes” means that the ferry emits more than twice what an average plane would on the same distance for one passenger.