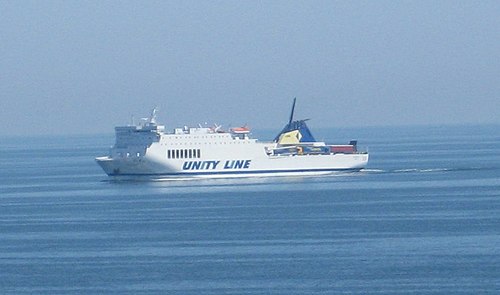
M/S Galileusz

better than riding a car with two passengers
(based on 2022 data)
Often travels on 1 routes
- Trelleborg [SE] ↔ Świnoujście [PL] - 177 km
⚠️
Do you know of a route that this ship frequently travels but is not listed? Or have you noticed an error?
Please help by letting us know, thank you 🙇🏽♀️
Please help by letting us know, thank you 🙇🏽♀️
Ship Statistics
| 2022 yearly CO₂ Emissions | |||
|---|---|---|---|
| assigned to | total | average | ratio |
| persons 🙎♀️ | 152 tonnes CO₂ | 38 g·CO₂/pax/n.mile | 0.9000047986037839 % ⚙️ |
| freight 🚛 | 16728 tonnes CO₂ | 146 kg·CO₂/m tonne/n.mile | 99 % ⚙️ |
| total | 16880 tonnes CO₂ | 269 kg·CO₂/n.mile | 100% |
| 2022 yearly statistics | |
|---|---|
| distance travelled | 116218 km ⚙️ |
| time at sea | 4364 hours |
| 2022 average statistics per journey | |
|---|---|
| average persons transported 🙎♀️ | 64 persons ⚙️ |
| average freight transported 🚛 | 1829 metric tons ⚙️ |
| average speed | 27 km/h ⚙️ |
2022 monitoring methods:
N/A
2022 Theoretical
EIV (Efficiency Indicator Values): 32.54 gCO₂/ton/nautical mile
﹖ details
| 2021 yearly CO₂ Emissions | |||
|---|---|---|---|
| assigned to | total | average | ratio |
| persons 🙎♀️ | 144 tonnes CO₂ | 37 g·CO₂/pax/n.mile | 0.8999975589467418 % ⚙️ |
| freight 🚛 | 15833 tonnes CO₂ | 145 kg·CO₂/m tonne/n.mile | 99 % ⚙️ |
| total | 15977 tonnes CO₂ | 269 kg·CO₂/n.mile | 100% |
| 2021 yearly statistics | |
|---|---|
| distance travelled | 109828 km ⚙️ |
| time at sea | 4142 hours |
| 2021 average statistics per journey | |
|---|---|
| average persons transported 🙎♀️ | 65 persons ⚙️ |
| average freight transported 🚛 | 1838 metric tons ⚙️ |
| average speed | 27 km/h ⚙️ |
2021 monitoring methods:
N/A
2021 Theoretical
EIV (Efficiency Indicator Values): 32.54 gCO₂/ton/nautical mile
﹖ details
| 2020 yearly CO₂ Emissions | |||
|---|---|---|---|
| assigned to | total | average | ratio |
| persons 🙎♀️ | 152 tonnes CO₂ | 40 g·CO₂/pax/n.mile | 0.9000701399594826 % ⚙️ |
| freight 🚛 | 16700 tonnes CO₂ | 169 kg·CO₂/m tonne/n.mile | 99 % ⚙️ |
| total | 16852 tonnes CO₂ | 268 kg·CO₂/n.mile | 100% |
| 2020 yearly statistics | |
|---|---|
| distance travelled | 116581 km ⚙️ |
| time at sea | 4291 hours |
| 2020 average statistics per journey | |
|---|---|
| average persons transported 🙎♀️ | 60 persons ⚙️ |
| average freight transported 🚛 | 1569 metric tons ⚙️ |
| average speed | 27 km/h ⚙️ |
2020 monitoring methods:
N/A
2020 Theoretical
EIV (Efficiency Indicator Values): 32.54 gCO₂/ton/nautical mile
﹖ details
| 2019 yearly CO₂ Emissions | |||
|---|---|---|---|
| assigned to | total | average | ratio |
| persons 🙎♀️ | 150 tonnes CO₂ | 36 g·CO₂/pax/n.mile | 0.8999476991539782 % ⚙️ |
| freight 🚛 | 16466 tonnes CO₂ | 161 kg·CO₂/m tonne/n.mile | 99 % ⚙️ |
| total | 16615 tonnes CO₂ | 272 kg·CO₂/n.mile | 100% |
| 2019 yearly statistics | |
|---|---|
| distance travelled | 113181 km ⚙️ |
| time at sea | 4159 hours |
| 2019 average statistics per journey | |
|---|---|
| average persons transported 🙎♀️ | 68 persons ⚙️ |
| average freight transported 🚛 | 1670 metric tons ⚙️ |
| average speed | 27 km/h ⚙️ |
2019 monitoring methods:
N/A
2019 Theoretical
EIV (Efficiency Indicator Values): 32.54 gCO₂/ton/nautical mile
﹖ details
| 2018 yearly CO₂ Emissions | |||
|---|---|---|---|
| assigned to | total | average | ratio |
| persons 🙎♀️ | 17087 tonnes CO₂ | 3626 g·CO₂/pax/n.mile | 100 % ⚙️ |
| freight 🚛 | N/A | N/A | -0.00005852378437420924 % ⚙️ |
| total | 17087 tonnes CO₂ | 270 kg·CO₂/n.mile | 100% |
| 2018 yearly statistics | |
|---|---|
| distance travelled | 117031 km ⚙️ |
| time at sea | 4286 hours |
| 2018 average statistics per journey | |
|---|---|
| average persons transported 🙎♀️ | 75 persons ⚙️ |
| average freight transported 🚛 | N/A |
| average speed | 27 km/h ⚙️ |
2018 monitoring methods:
N/A
2018 Theoretical
N/A
﹖ details
ℹ️
Figures with the icon ⚙️ were computed based on the published data.
You can find computation details on
this page ↗
GreenFerries is a hobby project, all the data shown here has no official value. It is Open Source, so you can double check and modify it.

The Ecoscore compares
average CO₂ emissions per passenger per km.
‟emits like 2.1 planes” means that the ferry emits more than twice what an average plane would on the same distance for one passenger.