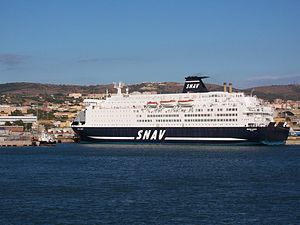
MS GNV Atlas

better than riding a car with two passengers
(based on 2022 data)
Often travels on 1 routes
- Barcelone [ES] ↔ Nador [MA] - 822 km
⚠️
Do you know of a route that this ship frequently travels but is not listed? Or have you noticed an error?
Please help by letting us know, thank you 🙇🏽♀️
Please help by letting us know, thank you 🙇🏽♀️
Ship Statistics
| 2022 yearly CO₂ Emissions | |||
|---|---|---|---|
| assigned to | total | average | ratio |
| persons 🙎♀️ | 1806 tonnes CO₂ | 43 g·CO₂/pax/n.mile | 4 % ⚙️ |
| freight 🚛 | 43356 tonnes CO₂ | 860 kg·CO₂/m tonne/n.mile | 96 % ⚙️ |
| total | 45163 tonnes CO₂ | 521 kg·CO₂/n.mile | 100% |
| 2022 yearly statistics | |
|---|---|
| distance travelled | 160512 km ⚙️ |
| time at sea | 5476 hours |
| 2022 average statistics per journey | |
|---|---|
| average persons transported 🙎♀️ | 481 persons ⚙️ |
| average freight transported 🚛 | 582 metric tons ⚙️ |
| average speed | 29 km/h ⚙️ |
2022 monitoring methods:
N/A
2022 Theoretical
EIV (Efficiency Indicator Values): 41.61 gCO₂/ton/nautical mile
﹖ details
| 2021 yearly CO₂ Emissions | |||
|---|---|---|---|
| assigned to | total | average | ratio |
| persons 🙎♀️ | 1297 tonnes CO₂ | 92 g·CO₂/pax/n.mile | 4 % ⚙️ |
| freight 🚛 | 31137 tonnes CO₂ | 700 kg·CO₂/m tonne/n.mile | 96 % ⚙️ |
| total | 32435 tonnes CO₂ | 656 kg·CO₂/n.mile | 100% |
| 2021 yearly statistics | |
|---|---|
| distance travelled | 91581 km ⚙️ |
| time at sea | 4736 hours |
| 2021 average statistics per journey | |
|---|---|
| average persons transported 🙎♀️ | 286 persons ⚙️ |
| average freight transported 🚛 | 900 metric tons ⚙️ |
| average speed | 19 km/h ⚙️ |
2021 monitoring methods:
N/A
2021 Theoretical
EIV (Efficiency Indicator Values): 41.61 gCO₂/ton/nautical mile
﹖ details
| 2020 yearly CO₂ Emissions | |||
|---|---|---|---|
| assigned to | total | average | ratio |
| persons 🙎♀️ | 41991 tonnes CO₂ | 1439 g·CO₂/pax/n.mile | 94 % ⚙️ |
| freight 🚛 | 2680 tonnes CO₂ | 33 kg·CO₂/m tonne/n.mile | 6 % ⚙️ |
| total | 44671 tonnes CO₂ | 507 kg·CO₂/n.mile | 100% |
| 2020 yearly statistics | |
|---|---|
| distance travelled | 163114 km ⚙️ |
| time at sea | 5661 hours |
| 2020 average statistics per journey | |
|---|---|
| average persons transported 🙎♀️ | 331 persons ⚙️ |
| average freight transported 🚛 | 934 metric tons ⚙️ |
| average speed | 29 km/h ⚙️ |
2020 monitoring methods:
N/A
2020 Theoretical
EIV (Efficiency Indicator Values): 41.61 gCO₂/ton/nautical mile
﹖ details
| 2019 yearly CO₂ Emissions | |||
|---|---|---|---|
| assigned to | total | average | ratio |
| persons 🙎♀️ | 47422 tonnes CO₂ | 767 g·CO₂/pax/n.mile | 94 % ⚙️ |
| freight 🚛 | 3027 tonnes CO₂ | 31 kg·CO₂/m tonne/n.mile | 6 % ⚙️ |
| total | 50449 tonnes CO₂ | 521 kg·CO₂/n.mile | 100% |
| 2019 yearly statistics | |
|---|---|
| distance travelled | 179321 km ⚙️ |
| time at sea | 6832 hours |
| 2019 average statistics per journey | |
|---|---|
| average persons transported 🙎♀️ | 639 persons ⚙️ |
| average freight transported 🚛 | 1009 metric tons ⚙️ |
| average speed | 26 km/h ⚙️ |
2019 monitoring methods:
N/A
2019 Theoretical
EIV (Efficiency Indicator Values): 41.61 gCO₂/ton/nautical mile
﹖ details
| 2018 yearly CO₂ Emissions | |||
|---|---|---|---|
| assigned to | total | average | ratio |
| persons 🙎♀️ | 40770 tonnes CO₂ | 1145 g·CO₂/pax/n.mile | 94 % ⚙️ |
| freight 🚛 | 2387 tonnes CO₂ | 0.09 kg·CO₂/m tonne/n.mile | 6 % ⚙️ |
| total | 43157 tonnes CO₂ | 591 kg·CO₂/n.mile | 100% |
| 2018 yearly statistics | |
|---|---|
| distance travelled | 135271 km ⚙️ |
| time at sea | 4457 hours |
| 2018 average statistics per journey | |
|---|---|
| average persons transported 🙎♀️ | 488 persons ⚙️ |
| average freight transported 🚛 | 363086 metric tons ⚙️ |
| average speed | 30 km/h ⚙️ |
2018 monitoring methods:
N/A
2018 Theoretical
EIV (Efficiency Indicator Values): 40.62 gCO₂/ton/nautical mile
﹖ details
ℹ️
Figures with the icon ⚙️ were computed based on the published data.
You can find computation details on
this page ↗
GreenFerries is a hobby project, all the data shown here has no official value. It is Open Source, so you can double check and modify it.

The Ecoscore compares
average CO₂ emissions per passenger per km.
‟emits like 2.1 planes” means that the ferry emits more than twice what an average plane would on the same distance for one passenger.