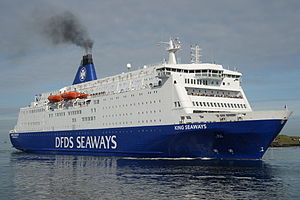
MS King Seaways

1 to 2 times an average plane's emissions
(based on 2022 data)
Often travels on 1 routes
- North Shields [GB] ↔ IJmuiden [NL] - 489 km
⚠️
Do you know of a route that this ship frequently travels but is not listed? Or have you noticed an error?
Please help by letting us know, thank you 🙇🏽♀️
Please help by letting us know, thank you 🙇🏽♀️
Ship Statistics
| 2022 yearly CO₂ Emissions | |||
|---|---|---|---|
| assigned to | total | average | ratio |
| persons 🙎♀️ | 29410 tonnes CO₂ | 452 g·CO₂/pax/n.mile | 74 % ⚙️ |
| freight 🚛 | 10333 tonnes CO₂ | 129 kg·CO₂/m tonne/n.mile | 26 % ⚙️ |
| total | 39743 tonnes CO₂ | 469 kg·CO₂/n.mile | 100% |
| 2022 yearly statistics | |
|---|---|
| distance travelled | 157047 km ⚙️ |
| time at sea | 5219 hours |
| 2022 average statistics per journey | |
|---|---|
| average persons transported 🙎♀️ | 767 persons ⚙️ |
| average freight transported 🚛 | 942 metric tons ⚙️ |
| average speed | 30 km/h ⚙️ |
2022 monitoring methods:
N/A
2022 Theoretical
EIV (Efficiency Indicator Values): 29.69 gCO₂/ton/nautical mile
﹖ details
| 2021 yearly CO₂ Emissions | |||
|---|---|---|---|
| assigned to | total | average | ratio |
| persons 🙎♀️ | 33385 tonnes CO₂ | 4048 g·CO₂/pax/n.mile | 74 % ⚙️ |
| freight 🚛 | 11730 tonnes CO₂ | 160 kg·CO₂/m tonne/n.mile | 26 % ⚙️ |
| total | 45114 tonnes CO₂ | 492 kg·CO₂/n.mile | 100% |
| 2021 yearly statistics | |
|---|---|
| distance travelled | 169948 km ⚙️ |
| time at sea | 5709 hours |
| 2021 average statistics per journey | |
|---|---|
| average persons transported 🙎♀️ | 90 persons ⚙️ |
| average freight transported 🚛 | 797 metric tons ⚙️ |
| average speed | 30 km/h ⚙️ |
2021 monitoring methods:
N/A
2021 Theoretical
EIV (Efficiency Indicator Values): 4.29 gCO₂/ton/nautical mile
﹖ details
| 2020 yearly CO₂ Emissions | |||
|---|---|---|---|
| assigned to | total | average | ratio |
| persons 🙎♀️ | 25732 tonnes CO₂ | 1602 g·CO₂/pax/n.mile | 74 % ⚙️ |
| freight 🚛 | 9041 tonnes CO₂ | 154 kg·CO₂/m tonne/n.mile | 26 % ⚙️ |
| total | 34773 tonnes CO₂ | 554 kg·CO₂/n.mile | 100% |
| 2020 yearly statistics | |
|---|---|
| distance travelled | 116336 km ⚙️ |
| time at sea | 3882 hours |
| 2020 average statistics per journey | |
|---|---|
| average persons transported 🙎♀️ | 256 persons ⚙️ |
| average freight transported 🚛 | 936 metric tons ⚙️ |
| average speed | 30 km/h ⚙️ |
2020 monitoring methods:
N/A
2020 Theoretical
EIV (Efficiency Indicator Values): 4.29 gCO₂/ton/nautical mile
﹖ details
| 2019 yearly CO₂ Emissions | |||
|---|---|---|---|
| assigned to | total | average | ratio |
| persons 🙎♀️ | 33226 tonnes CO₂ | 383 g·CO₂/pax/n.mile | 74 % ⚙️ |
| freight 🚛 | 11674 tonnes CO₂ | 126 kg·CO₂/m tonne/n.mile | 26 % ⚙️ |
| total | 44900 tonnes CO₂ | 497 kg·CO₂/n.mile | 100% |
| 2019 yearly statistics | |
|---|---|
| distance travelled | 167277 km ⚙️ |
| time at sea | 5565 hours |
| 2019 average statistics per journey | |
|---|---|
| average persons transported 🙎♀️ | 960 persons ⚙️ |
| average freight transported 🚛 | 1022 metric tons ⚙️ |
| average speed | 30 km/h ⚙️ |
2019 monitoring methods:
N/A
2019 Theoretical
EIV (Efficiency Indicator Values): 4.29 gCO₂/ton/nautical mile
﹖ details
| 2018 yearly CO₂ Emissions | |||
|---|---|---|---|
| assigned to | total | average | ratio |
| persons 🙎♀️ | 50671 tonnes CO₂ | 591 g·CO₂/pax/n.mile | 100 % ⚙️ |
| freight 🚛 | 50671 tonnes CO₂ | N/A | N/A |
| total | 50671 tonnes CO₂ | 535 kg·CO₂/n.mile | 100% |
| 2018 yearly statistics | |
|---|---|
| distance travelled | 175407 km ⚙️ |
| time at sea | 6078 hours |
| 2018 average statistics per journey | |
|---|---|
| average persons transported 🙎♀️ | 906 persons ⚙️ |
| average freight transported 🚛 | N/A |
| average speed | 29 km/h ⚙️ |
2018 monitoring methods:
N/A
2018 Theoretical
EIV (Efficiency Indicator Values): 4.29 gCO₂/ton/nautical mile
﹖ details
ℹ️
Figures with the icon ⚙️ were computed based on the published data.
You can find computation details on
this page ↗
GreenFerries is a hobby project, all the data shown here has no official value. It is Open Source, so you can double check and modify it.

The Ecoscore compares
average CO₂ emissions per passenger per km.
‟emits like 2.1 planes” means that the ferry emits more than twice what an average plane would on the same distance for one passenger.