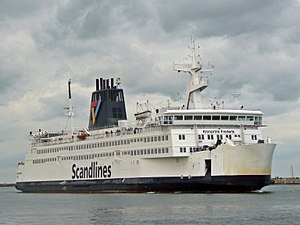
MS Kronprins Frederik

over 4 times an average plane's emissions
(based on 2022 data)
Often travels on 1 routes
- Puttgarden [DE] ↔ Rødby [DK] - 25 km
⚠️
Do you know of a route that this ship frequently travels but is not listed? Or have you noticed an error?
Please help by letting us know, thank you 🙇🏽♀️
Please help by letting us know, thank you 🙇🏽♀️
Ship Statistics
| 2022 yearly CO₂ Emissions | |||
|---|---|---|---|
| assigned to | total | average | ratio |
| persons 🙎♀️ | 3721 tonnes CO₂ | 69053 g·CO₂/pax/n.mile | 56 % ⚙️ |
| freight 🚛 | 2947 tonnes CO₂ | 258 kg·CO₂/m tonne/n.mile | 44 % ⚙️ |
| total | 6667 tonnes CO₂ | 457 kg·CO₂/n.mile | 100% |
| 2022 yearly statistics | |
|---|---|
| distance travelled | 27021 km ⚙️ |
| time at sea | N/A |
| 2022 average statistics per journey | |
|---|---|
| average persons transported 🙎♀️ | 4 persons ⚙️ |
| average freight transported 🚛 | 783 metric tons ⚙️ |
| average speed | N/A |
2022 monitoring methods:
N/A
2022 Theoretical
N/A
﹖ details
| 2021 yearly CO₂ Emissions | |||
|---|---|---|---|
| assigned to | total | average | ratio |
| persons 🙎♀️ | 2800 tonnes CO₂ | 88522 g·CO₂/pax/n.mile | 56 % ⚙️ |
| freight 🚛 | 2218 tonnes CO₂ | 324 kg·CO₂/m tonne/n.mile | 44 % ⚙️ |
| total | 5033 tonnes CO₂ | 490 kg·CO₂/n.mile | 100% |
| 2021 yearly statistics | |
|---|---|
| distance travelled | 19011 km ⚙️ |
| time at sea | 985 hours |
| 2021 average statistics per journey | |
|---|---|
| average persons transported 🙎♀️ | 3 persons ⚙️ |
| average freight transported 🚛 | 667 metric tons ⚙️ |
| average speed | 19 km/h ⚙️ |
2021 monitoring methods:
N/A
2021 Theoretical
N/A
﹖ details
| 2020 yearly CO₂ Emissions | |||
|---|---|---|---|
| assigned to | total | average | ratio |
| persons 🙎♀️ | 93 tonnes CO₂ | 8431 g·CO₂/pax/n.mile | 6 % ⚙️ |
| freight 🚛 | 1439 tonnes CO₂ | 609 kg·CO₂/m tonne/n.mile | 94 % ⚙️ |
| total | 1532 tonnes CO₂ | 413 kg·CO₂/n.mile | 100% |
| 2020 yearly statistics | |
|---|---|
| distance travelled | 6862 km ⚙️ |
| time at sea | 354 hours |
| 2020 average statistics per journey | |
|---|---|
| average persons transported 🙎♀️ | 3 persons ⚙️ |
| average freight transported 🚛 | 638 metric tons ⚙️ |
| average speed | 19 km/h ⚙️ |
2020 monitoring methods:
N/A
2020 Theoretical
N/A
﹖ details
| 2019 yearly CO₂ Emissions | |||
|---|---|---|---|
| assigned to | total | average | ratio |
| persons 🙎♀️ | 6318 tonnes CO₂ | 15912 g·CO₂/pax/n.mile | 100 % ⚙️ |
| freight 🚛 | 6318 tonnes CO₂ | 721 kg·CO₂/m tonne/n.mile | N/A |
| total | 6318 tonnes CO₂ | 490 kg·CO₂/n.mile | 100% |
| 2019 yearly statistics | |
|---|---|
| distance travelled | 23872 km ⚙️ |
| time at sea | 1209 hours |
| 2019 average statistics per journey | |
|---|---|
| average persons transported 🙎♀️ | 31 persons ⚙️ |
| average freight transported 🚛 | 680 metric tons ⚙️ |
| average speed | 20 km/h ⚙️ |
2019 monitoring methods:
N/A
2019 Theoretical
N/A
﹖ details
| 2018 yearly CO₂ Emissions | |||
|---|---|---|---|
| assigned to | total | average | ratio |
| persons 🙎♀️ | 5650 tonnes CO₂ | 21524 g·CO₂/pax/n.mile | 100 % ⚙️ |
| freight 🚛 | 5650 tonnes CO₂ | 1152 kg·CO₂/m tonne/n.mile | N/A |
| total | 5650 tonnes CO₂ | 655 kg·CO₂/n.mile | 100% |
| 2018 yearly statistics | |
|---|---|
| distance travelled | 15964 km ⚙️ |
| time at sea | 862 hours |
| 2018 average statistics per journey | |
|---|---|
| average persons transported 🙎♀️ | 30 persons ⚙️ |
| average freight transported 🚛 | 569 metric tons ⚙️ |
| average speed | 19 km/h ⚙️ |
2018 monitoring methods:
N/A
2018 Theoretical
N/A
﹖ details
ℹ️
Figures with the icon ⚙️ were computed based on the published data.
You can find computation details on
this page ↗
GreenFerries is a hobby project, all the data shown here has no official value. It is Open Source, so you can double check and modify it.

The Ecoscore compares
average CO₂ emissions per passenger per km.
‟emits like 2.1 planes” means that the ferry emits more than twice what an average plane would on the same distance for one passenger.