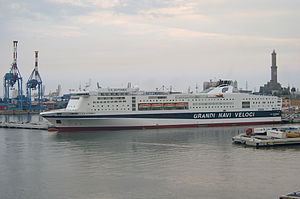
MS La Superba

over 4 times an average plane's emissions
(based on 2022 data)
Often travels on 1 routes
- Gênes [IT] ↔ Tunis [TN] - 850 km
⚠️
Do you know of a route that this ship frequently travels but is not listed? Or have you noticed an error?
Please help by letting us know, thank you 🙇🏽♀️
Please help by letting us know, thank you 🙇🏽♀️
Ship Statistics
| 2022 yearly CO₂ Emissions | |||
|---|---|---|---|
| assigned to | total | average | ratio |
| persons 🙎♀️ | 99213 tonnes CO₂ | 1182 g·CO₂/pax/n.mile | 92 % ⚙️ |
| freight 🚛 | 8177 tonnes CO₂ | 91 kg·CO₂/m tonne/n.mile | 8 % ⚙️ |
| total | 107390 tonnes CO₂ | 953 kg·CO₂/n.mile | 100% |
| 2022 yearly statistics | |
|---|---|
| distance travelled | 208678 km ⚙️ |
| time at sea | 5012 hours |
| 2022 average statistics per journey | |
|---|---|
| average persons transported 🙎♀️ | 745 persons ⚙️ |
| average freight transported 🚛 | 795 metric tons ⚙️ |
| average speed | 42 km/h ⚙️ |
2022 monitoring methods:
N/A
2022 Theoretical
EIV (Efficiency Indicator Values): 31.13 gCO₂/ton/nautical mile
﹖ details
| 2021 yearly CO₂ Emissions | |||
|---|---|---|---|
| assigned to | total | average | ratio |
| persons 🙎♀️ | 74631 tonnes CO₂ | 1130 g·CO₂/pax/n.mile | 92 % ⚙️ |
| freight 🚛 | 6488 tonnes CO₂ | 65 kg·CO₂/m tonne/n.mile | 8 % ⚙️ |
| total | 81120 tonnes CO₂ | 1005 kg·CO₂/n.mile | 100% |
| 2021 yearly statistics | |
|---|---|
| distance travelled | 149544 km ⚙️ |
| time at sea | 3571 hours |
| 2021 average statistics per journey | |
|---|---|
| average persons transported 🙎♀️ | 818 persons ⚙️ |
| average freight transported 🚛 | 1234 metric tons ⚙️ |
| average speed | 42 km/h ⚙️ |
2021 monitoring methods:
N/A
2021 Theoretical
EIV (Efficiency Indicator Values): 31.13 gCO₂/ton/nautical mile
﹖ details
| 2020 yearly CO₂ Emissions | |||
|---|---|---|---|
| assigned to | total | average | ratio |
| persons 🙎♀️ | 100273 tonnes CO₂ | 2036 g·CO₂/pax/n.mile | 92 % ⚙️ |
| freight 🚛 | 8267 tonnes CO₂ | 79 kg·CO₂/m tonne/n.mile | 8 % ⚙️ |
| total | 108540 tonnes CO₂ | 873 kg·CO₂/n.mile | 100% |
| 2020 yearly statistics | |
|---|---|
| distance travelled | 230169 km ⚙️ |
| time at sea | 5683 hours |
| 2020 average statistics per journey | |
|---|---|
| average persons transported 🙎♀️ | 396 persons ⚙️ |
| average freight transported 🚛 | 843 metric tons ⚙️ |
| average speed | 41 km/h ⚙️ |
2020 monitoring methods:
N/A
2020 Theoretical
EIV (Efficiency Indicator Values): 31.13 gCO₂/ton/nautical mile
﹖ details
| 2019 yearly CO₂ Emissions | |||
|---|---|---|---|
| assigned to | total | average | ratio |
| persons 🙎♀️ | 105415 tonnes CO₂ | 1162 g·CO₂/pax/n.mile | 92 % ⚙️ |
| freight 🚛 | 8688 tonnes CO₂ | 73 kg·CO₂/m tonne/n.mile | 8 % ⚙️ |
| total | 114103 tonnes CO₂ | 853 kg·CO₂/n.mile | 100% |
| 2019 yearly statistics | |
|---|---|
| distance travelled | 247707 km ⚙️ |
| time at sea | 6109 hours |
| 2019 average statistics per journey | |
|---|---|
| average persons transported 🙎♀️ | 678 persons ⚙️ |
| average freight transported 🚛 | 888 metric tons ⚙️ |
| average speed | 41 km/h ⚙️ |
2019 monitoring methods:
N/A
2019 Theoretical
EIV (Efficiency Indicator Values): 31.13 gCO₂/ton/nautical mile
﹖ details
| 2018 yearly CO₂ Emissions | |||
|---|---|---|---|
| assigned to | total | average | ratio |
| persons 🙎♀️ | 83451 tonnes CO₂ | 985 g·CO₂/pax/n.mile | 92 % ⚙️ |
| freight 🚛 | 6877 tonnes CO₂ | 75 kg·CO₂/m tonne/n.mile | 8 % ⚙️ |
| total | 90329 tonnes CO₂ | 838 kg·CO₂/n.mile | 100% |
| 2018 yearly statistics | |
|---|---|
| distance travelled | 199717 km ⚙️ |
| time at sea | 4899 hours |
| 2018 average statistics per journey | |
|---|---|
| average persons transported 🙎♀️ | 786 persons ⚙️ |
| average freight transported 🚛 | 852 metric tons ⚙️ |
| average speed | 41 km/h ⚙️ |
2018 monitoring methods:
N/A
2018 Theoretical
EIV (Efficiency Indicator Values): 31.13 gCO₂/ton/nautical mile
﹖ details
ℹ️
Figures with the icon ⚙️ were computed based on the published data.
You can find computation details on
this page ↗
GreenFerries is a hobby project, all the data shown here has no official value. It is Open Source, so you can double check and modify it.

The Ecoscore compares
average CO₂ emissions per passenger per km.
‟emits like 2.1 planes” means that the ferry emits more than twice what an average plane would on the same distance for one passenger.