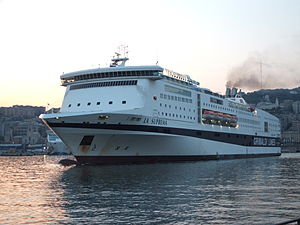
MS La Suprema

2 to 4 times an average plane's emissions
(based on 2022 data)
Often travels on 1 routes
- Gênes [IT] ↔ Palerme [IT] - 788 km
⚠️
Do you know of a route that this ship frequently travels but is not listed? Or have you noticed an error?
Please help by letting us know, thank you 🙇🏽♀️
Please help by letting us know, thank you 🙇🏽♀️
Ship Statistics
| 2022 yearly CO₂ Emissions | |||
|---|---|---|---|
| assigned to | total | average | ratio |
| persons 🙎♀️ | 91734 tonnes CO₂ | 1040 g·CO₂/pax/n.mile | 93 % ⚙️ |
| freight 🚛 | 7179 tonnes CO₂ | 75 kg·CO₂/m tonne/n.mile | 7 % ⚙️ |
| total | 98913 tonnes CO₂ | 861 kg·CO₂/n.mile | 100% |
| 2022 yearly statistics | |
|---|---|
| distance travelled | 212755 km ⚙️ |
| time at sea | 5274 hours |
| 2022 average statistics per journey | |
|---|---|
| average persons transported 🙎♀️ | 768 persons ⚙️ |
| average freight transported 🚛 | 831 metric tons ⚙️ |
| average speed | 40 km/h ⚙️ |
2022 monitoring methods:
N/A
2022 Theoretical
EIV (Efficiency Indicator Values): 30.63 gCO₂/ton/nautical mile
﹖ details
| 2021 yearly CO₂ Emissions | |||
|---|---|---|---|
| assigned to | total | average | ratio |
| persons 🙎♀️ | 65352 tonnes CO₂ | 1190 g·CO₂/pax/n.mile | 93 % ⚙️ |
| freight 🚛 | 4922 tonnes CO₂ | 63 kg·CO₂/m tonne/n.mile | 7 % ⚙️ |
| total | 70273 tonnes CO₂ | 875 kg·CO₂/n.mile | 100% |
| 2021 yearly statistics | |
|---|---|
| distance travelled | 148742 km ⚙️ |
| time at sea | 3631 hours |
| 2021 average statistics per journey | |
|---|---|
| average persons transported 🙎♀️ | 684 persons ⚙️ |
| average freight transported 🚛 | 975 metric tons ⚙️ |
| average speed | 41 km/h ⚙️ |
2021 monitoring methods:
N/A
2021 Theoretical
EIV (Efficiency Indicator Values): 30.63 gCO₂/ton/nautical mile
﹖ details
| 2020 yearly CO₂ Emissions | |||
|---|---|---|---|
| assigned to | total | average | ratio |
| persons 🙎♀️ | 76657 tonnes CO₂ | 1465 g·CO₂/pax/n.mile | 93 % ⚙️ |
| freight 🚛 | 6001 tonnes CO₂ | 64 kg·CO₂/m tonne/n.mile | 7 % ⚙️ |
| total | 82658 tonnes CO₂ | 761 kg·CO₂/n.mile | 100% |
| 2020 yearly statistics | |
|---|---|
| distance travelled | 201128 km ⚙️ |
| time at sea | 5015 hours |
| 2020 average statistics per journey | |
|---|---|
| average persons transported 🙎♀️ | 482 persons ⚙️ |
| average freight transported 🚛 | 859 metric tons ⚙️ |
| average speed | 40 km/h ⚙️ |
2020 monitoring methods:
N/A
2020 Theoretical
EIV (Efficiency Indicator Values): 30.63 gCO₂/ton/nautical mile
﹖ details
| 2019 yearly CO₂ Emissions | |||
|---|---|---|---|
| assigned to | total | average | ratio |
| persons 🙎♀️ | 95265 tonnes CO₂ | 1009 g·CO₂/pax/n.mile | 93 % ⚙️ |
| freight 🚛 | 7456 tonnes CO₂ | 58 kg·CO₂/m tonne/n.mile | 7 % ⚙️ |
| total | 102720 tonnes CO₂ | 779 kg·CO₂/n.mile | 100% |
| 2019 yearly statistics | |
|---|---|
| distance travelled | 244123 km ⚙️ |
| time at sea | 5994 hours |
| 2019 average statistics per journey | |
|---|---|
| average persons transported 🙎♀️ | 716 persons ⚙️ |
| average freight transported 🚛 | 983 metric tons ⚙️ |
| average speed | 41 km/h ⚙️ |
2019 monitoring methods:
N/A
2019 Theoretical
EIV (Efficiency Indicator Values): 30.63 gCO₂/ton/nautical mile
﹖ details
| 2018 yearly CO₂ Emissions | |||
|---|---|---|---|
| assigned to | total | average | ratio |
| persons 🙎♀️ | 68389 tonnes CO₂ | 865 g·CO₂/pax/n.mile | 93 % ⚙️ |
| freight 🚛 | 5354 tonnes CO₂ | 65 kg·CO₂/m tonne/n.mile | 7 % ⚙️ |
| total | 73743 tonnes CO₂ | 815 kg·CO₂/n.mile | 100% |
| 2018 yearly statistics | |
|---|---|
| distance travelled | 167647 km ⚙️ |
| time at sea | 4115 hours |
| 2018 average statistics per journey | |
|---|---|
| average persons transported 🙎♀️ | 874 persons ⚙️ |
| average freight transported 🚛 | 909 metric tons ⚙️ |
| average speed | 41 km/h ⚙️ |
2018 monitoring methods:
N/A
2018 Theoretical
EIV (Efficiency Indicator Values): 30.63 gCO₂/ton/nautical mile
﹖ details
ℹ️
Figures with the icon ⚙️ were computed based on the published data.
You can find computation details on
this page ↗
GreenFerries is a hobby project, all the data shown here has no official value. It is Open Source, so you can double check and modify it.

The Ecoscore compares
average CO₂ emissions per passenger per km.
‟emits like 2.1 planes” means that the ferry emits more than twice what an average plane would on the same distance for one passenger.