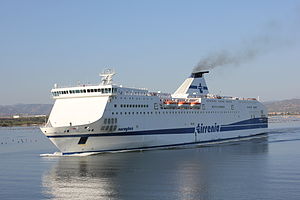
MS Nuraghes

1 to 2 times an average plane's emissions
(based on 2022 data)
Often travels on 1 routes
- Gênes [IT] ↔ Porto Torres [IT] - 399 km
⚠️
Do you know of a route that this ship frequently travels but is not listed? Or have you noticed an error?
Please help by letting us know, thank you 🙇🏽♀️
Please help by letting us know, thank you 🙇🏽♀️
Ship Statistics
| 2022 yearly CO₂ Emissions | |||
|---|---|---|---|
| assigned to | total | average | ratio |
| persons 🙎♀️ | 31976 tonnes CO₂ | 445 g·CO₂/pax/n.mile | 71 % ⚙️ |
| freight 🚛 | 13061 tonnes CO₂ | 65 kg·CO₂/m tonne/n.mile | 29 % ⚙️ |
| total | 45037 tonnes CO₂ | 697 kg·CO₂/n.mile | 100% |
| 2022 yearly statistics | |
|---|---|
| distance travelled | 119591 km ⚙️ |
| time at sea | 3700 hours |
| 2022 average statistics per journey | |
|---|---|
| average persons transported 🙎♀️ | 1112 persons ⚙️ |
| average freight transported 🚛 | 3131 metric tons ⚙️ |
| average speed | 32 km/h ⚙️ |
2022 monitoring methods:
N/A
2022 Theoretical
EIV (Efficiency Indicator Values): 9.72 gCO₂/ton/nautical mile
﹖ details
| 2021 yearly CO₂ Emissions | |||
|---|---|---|---|
| assigned to | total | average | ratio |
| persons 🙎♀️ | 31470 tonnes CO₂ | 485 g·CO₂/pax/n.mile | 67 % ⚙️ |
| freight 🚛 | 15500 tonnes CO₂ | 72 kg·CO₂/m tonne/n.mile | 33 % ⚙️ |
| total | 46970 tonnes CO₂ | 713 kg·CO₂/n.mile | 100% |
| 2021 yearly statistics | |
|---|---|
| distance travelled | 121939 km ⚙️ |
| time at sea | 3730 hours |
| 2021 average statistics per journey | |
|---|---|
| average persons transported 🙎♀️ | 985 persons ⚙️ |
| average freight transported 🚛 | 3252 metric tons ⚙️ |
| average speed | 33 km/h ⚙️ |
2021 monitoring methods:
N/A
2021 Theoretical
EIV (Efficiency Indicator Values): 9.72 gCO₂/ton/nautical mile
﹖ details
| 2020 yearly CO₂ Emissions | |||
|---|---|---|---|
| assigned to | total | average | ratio |
| persons 🙎♀️ | 32561 tonnes CO₂ | 503 g·CO₂/pax/n.mile | 71 % ⚙️ |
| freight 🚛 | 13300 tonnes CO₂ | 76 kg·CO₂/m tonne/n.mile | 29 % ⚙️ |
| total | 45861 tonnes CO₂ | 712 kg·CO₂/n.mile | 100% |
| 2020 yearly statistics | |
|---|---|
| distance travelled | 119352 km ⚙️ |
| time at sea | 3596 hours |
| 2020 average statistics per journey | |
|---|---|
| average persons transported 🙎♀️ | 1005 persons ⚙️ |
| average freight transported 🚛 | 2698 metric tons ⚙️ |
| average speed | 33 km/h ⚙️ |
2020 monitoring methods:
N/A
2020 Theoretical
EIV (Efficiency Indicator Values): 9.72 gCO₂/ton/nautical mile
﹖ details
| 2019 yearly CO₂ Emissions | |||
|---|---|---|---|
| assigned to | total | average | ratio |
| persons 🙎♀️ | 37765 tonnes CO₂ | 856 g·CO₂/pax/n.mile | 77 % ⚙️ |
| freight 🚛 | 11280 tonnes CO₂ | 100 kg·CO₂/m tonne/n.mile | 23 % ⚙️ |
| total | 49045 tonnes CO₂ | 667 kg·CO₂/n.mile | 100% |
| 2019 yearly statistics | |
|---|---|
| distance travelled | 136090 km ⚙️ |
| time at sea | 3965 hours |
| 2019 average statistics per journey | |
|---|---|
| average persons transported 🙎♀️ | 601 persons ⚙️ |
| average freight transported 🚛 | 1542 metric tons ⚙️ |
| average speed | 34 km/h ⚙️ |
2019 monitoring methods:
N/A
2019 Theoretical
EIV (Efficiency Indicator Values): 9.72 gCO₂/ton/nautical mile
﹖ details
| 2018 yearly CO₂ Emissions | |||
|---|---|---|---|
| assigned to | total | average | ratio |
| persons 🙎♀️ | 36506 tonnes CO₂ | 812 g·CO₂/pax/n.mile | 74 % ⚙️ |
| freight 🚛 | 12827 tonnes CO₂ | 103 kg·CO₂/m tonne/n.mile | 26 % ⚙️ |
| total | 49333 tonnes CO₂ | 632 kg·CO₂/n.mile | 100% |
| 2018 yearly statistics | |
|---|---|
| distance travelled | 144649 km ⚙️ |
| time at sea | 4428 hours |
| 2018 average statistics per journey | |
|---|---|
| average persons transported 🙎♀️ | 575 persons ⚙️ |
| average freight transported 🚛 | 1592 metric tons ⚙️ |
| average speed | 33 km/h ⚙️ |
2018 monitoring methods:
N/A
2018 Theoretical
EIV (Efficiency Indicator Values): 9.72 gCO₂/ton/nautical mile
﹖ details
ℹ️
Figures with the icon ⚙️ were computed based on the published data.
You can find computation details on
this page ↗
GreenFerries is a hobby project, all the data shown here has no official value. It is Open Source, so you can double check and modify it.

The Ecoscore compares
average CO₂ emissions per passenger per km.
‟emits like 2.1 planes” means that the ferry emits more than twice what an average plane would on the same distance for one passenger.