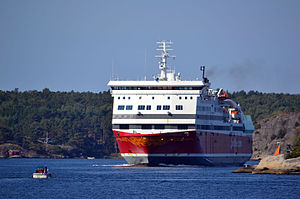
MS Oslofjord

2 to 4 times an average plane's emissions
(based on 2022 data)
Often travels on 1 routes
- Sandefjord [NO] ↔ Strömstad [SE] - 58 km
⚠️
Do you know of a route that this ship frequently travels but is not listed? Or have you noticed an error?
Please help by letting us know, thank you 🙇🏽♀️
Please help by letting us know, thank you 🙇🏽♀️
Ship Statistics
| 2022 yearly CO₂ Emissions | |||
|---|---|---|---|
| assigned to | total | average | ratio |
| persons 🙎♀️ | 11319 tonnes CO₂ | 915 g·CO₂/pax/n.mile | 84 % ⚙️ |
| freight 🚛 | 2127 tonnes CO₂ | 1912 kg·CO₂/m tonne/n.mile | 16 % ⚙️ |
| total | 13446 tonnes CO₂ | 286 kg·CO₂/n.mile | 100% |
| 2022 yearly statistics | |
|---|---|
| distance travelled | 87029 km ⚙️ |
| time at sea | 3946 hours |
| 2022 average statistics per journey | |
|---|---|
| average persons transported 🙎♀️ | 263 persons ⚙️ |
| average freight transported 🚛 | 24 metric tons ⚙️ |
| average speed | 22 km/h ⚙️ |
2022 monitoring methods:
N/A
2022 Theoretical
EIV (Efficiency Indicator Values): 11 gCO₂/ton/nautical mile
﹖ details
| 2021 yearly CO₂ Emissions | |||
|---|---|---|---|
| assigned to | total | average | ratio |
| persons 🙎♀️ | 6100 tonnes CO₂ | 1346 g·CO₂/pax/n.mile | 75 % ⚙️ |
| freight 🚛 | 1830 tonnes CO₂ | 1755 kg·CO₂/m tonne/n.mile | 25 % ⚙️ |
| total | 8184 tonnes CO₂ | 312 kg·CO₂/n.mile | 100% |
| 2021 yearly statistics | |
|---|---|
| distance travelled | 48558 km ⚙️ |
| time at sea | 2135 hours |
| 2021 average statistics per journey | |
|---|---|
| average persons transported 🙎♀️ | 173 persons ⚙️ |
| average freight transported 🚛 | 40 metric tons ⚙️ |
| average speed | 23 km/h ⚙️ |
2021 monitoring methods:
N/A
2021 Theoretical
EIV (Efficiency Indicator Values): 11 gCO₂/ton/nautical mile
﹖ details
| 2020 yearly CO₂ Emissions | |||
|---|---|---|---|
| assigned to | total | average | ratio |
| persons 🙎♀️ | 2565 tonnes CO₂ | 1544 g·CO₂/pax/n.mile | 61 % ⚙️ |
| freight 🚛 | 1241 tonnes CO₂ | 1243 kg·CO₂/m tonne/n.mile | 39 % ⚙️ |
| total | 4193 tonnes CO₂ | 364 kg·CO₂/n.mile | 100% |
| 2020 yearly statistics | |
|---|---|
| distance travelled | 21320 km ⚙️ |
| time at sea | 776 hours |
| 2020 average statistics per journey | |
|---|---|
| average persons transported 🙎♀️ | 144 persons ⚙️ |
| average freight transported 🚛 | 87 metric tons ⚙️ |
| average speed | 27 km/h ⚙️ |
2020 monitoring methods:
N/A
2020 Theoretical
EIV (Efficiency Indicator Values): 11 gCO₂/ton/nautical mile
﹖ details
| 2019 yearly CO₂ Emissions | |||
|---|---|---|---|
| assigned to | total | average | ratio |
| persons 🙎♀️ | 13039 tonnes CO₂ | 794 g·CO₂/pax/n.mile | 82 % ⚙️ |
| freight 🚛 | 2318 tonnes CO₂ | 1087 kg·CO₂/m tonne/n.mile | 18 % ⚙️ |
| total | 15911 tonnes CO₂ | 312 kg·CO₂/n.mile | 100% |
| 2019 yearly statistics | |
|---|---|
| distance travelled | 94542 km ⚙️ |
| time at sea | 4351 hours |
| 2019 average statistics per journey | |
|---|---|
| average persons transported 🙎♀️ | 321 persons ⚙️ |
| average freight transported 🚛 | 42 metric tons ⚙️ |
| average speed | 22 km/h ⚙️ |
2019 monitoring methods:
N/A
2019 Theoretical
EIV (Efficiency Indicator Values): 11 gCO₂/ton/nautical mile
﹖ details
| 2018 yearly CO₂ Emissions | |||
|---|---|---|---|
| assigned to | total | average | ratio |
| persons 🙎♀️ | 13606 tonnes CO₂ | 823 g·CO₂/pax/n.mile | 83 % ⚙️ |
| freight 🚛 | 2786 tonnes CO₂ | 1129 kg·CO₂/m tonne/n.mile | 17 % ⚙️ |
| total | 16392 tonnes CO₂ | 318 kg·CO₂/n.mile | 100% |
| 2018 yearly statistics | |
|---|---|
| distance travelled | 95605 km ⚙️ |
| time at sea | 3917 hours |
| 2018 average statistics per journey | |
|---|---|
| average persons transported 🙎♀️ | 320 persons ⚙️ |
| average freight transported 🚛 | 48 metric tons ⚙️ |
| average speed | 24 km/h ⚙️ |
2018 monitoring methods:
N/A
2018 Theoretical
EIV (Efficiency Indicator Values): 11 gCO₂/ton/nautical mile
﹖ details
ℹ️
Figures with the icon ⚙️ were computed based on the published data.
You can find computation details on
this page ↗
GreenFerries is a hobby project, all the data shown here has no official value. It is Open Source, so you can double check and modify it.

The Ecoscore compares
average CO₂ emissions per passenger per km.
‟emits like 2.1 planes” means that the ferry emits more than twice what an average plane would on the same distance for one passenger.