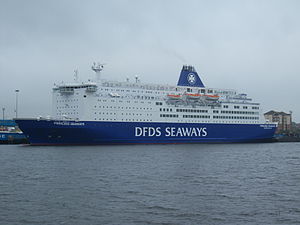
MS Princess Seaways

1 to 2 times an average plane's emissions
(based on 2022 data)
Often travels on 1 routes
- North Shields [GB] ↔ IJmuiden [NL] - 489 km
⚠️
Do you know of a route that this ship frequently travels but is not listed? Or have you noticed an error?
Please help by letting us know, thank you 🙇🏽♀️
Please help by letting us know, thank you 🙇🏽♀️
Ship Statistics
| 2022 yearly CO₂ Emissions | |||
|---|---|---|---|
| assigned to | total | average | ratio |
| persons 🙎♀️ | 29702 tonnes CO₂ | 474 g·CO₂/pax/n.mile | 69 % ⚙️ |
| freight 🚛 | 13344 tonnes CO₂ | 149 kg·CO₂/m tonne/n.mile | 31 % ⚙️ |
| total | 43046 tonnes CO₂ | 461 kg·CO₂/n.mile | 100% |
| 2022 yearly statistics | |
|---|---|
| distance travelled | 173093 km ⚙️ |
| time at sea | 5792 hours |
| 2022 average statistics per journey | |
|---|---|
| average persons transported 🙎♀️ | 670 persons ⚙️ |
| average freight transported 🚛 | 956 metric tons ⚙️ |
| average speed | 30 km/h ⚙️ |
2022 monitoring methods:
N/A
2022 Theoretical
EIV (Efficiency Indicator Values): 29.66 gCO₂/ton/nautical mile
﹖ details
| 2021 yearly CO₂ Emissions | |||
|---|---|---|---|
| assigned to | total | average | ratio |
| persons 🙎♀️ | 27150 tonnes CO₂ | 3338 g·CO₂/pax/n.mile | 69 % ⚙️ |
| freight 🚛 | 12198 tonnes CO₂ | 185 kg·CO₂/m tonne/n.mile | 31 % ⚙️ |
| total | 39348 tonnes CO₂ | 472 kg·CO₂/n.mile | 100% |
| 2021 yearly statistics | |
|---|---|
| distance travelled | 154551 km ⚙️ |
| time at sea | 5190 hours |
| 2021 average statistics per journey | |
|---|---|
| average persons transported 🙎♀️ | 97 persons ⚙️ |
| average freight transported 🚛 | 789 metric tons ⚙️ |
| average speed | 30 km/h ⚙️ |
2021 monitoring methods:
N/A
2021 Theoretical
EIV (Efficiency Indicator Values): 5.27 gCO₂/ton/nautical mile
﹖ details
| 2020 yearly CO₂ Emissions | |||
|---|---|---|---|
| assigned to | total | average | ratio |
| persons 🙎♀️ | 22082 tonnes CO₂ | 1527 g·CO₂/pax/n.mile | 69 % ⚙️ |
| freight 🚛 | 9921 tonnes CO₂ | 179 kg·CO₂/m tonne/n.mile | 31 % ⚙️ |
| total | 32003 tonnes CO₂ | 540 kg·CO₂/n.mile | 100% |
| 2020 yearly statistics | |
|---|---|
| distance travelled | 109743 km ⚙️ |
| time at sea | 3697 hours |
| 2020 average statistics per journey | |
|---|---|
| average persons transported 🙎♀️ | 244 persons ⚙️ |
| average freight transported 🚛 | 938 metric tons ⚙️ |
| average speed | 30 km/h ⚙️ |
2020 monitoring methods:
N/A
2020 Theoretical
EIV (Efficiency Indicator Values): 5.27 gCO₂/ton/nautical mile
﹖ details
| 2019 yearly CO₂ Emissions | |||
|---|---|---|---|
| assigned to | total | average | ratio |
| persons 🙎♀️ | 31248 tonnes CO₂ | 431 g·CO₂/pax/n.mile | 69 % ⚙️ |
| freight 🚛 | 14039 tonnes CO₂ | 155 kg·CO₂/m tonne/n.mile | 31 % ⚙️ |
| total | 45287 tonnes CO₂ | 490 kg·CO₂/n.mile | 100% |
| 2019 yearly statistics | |
|---|---|
| distance travelled | 171159 km ⚙️ |
| time at sea | 5799 hours |
| 2019 average statistics per journey | |
|---|---|
| average persons transported 🙎♀️ | 785 persons ⚙️ |
| average freight transported 🚛 | 977 metric tons ⚙️ |
| average speed | 30 km/h ⚙️ |
2019 monitoring methods:
N/A
2019 Theoretical
EIV (Efficiency Indicator Values): 5.27 gCO₂/ton/nautical mile
﹖ details
| 2018 yearly CO₂ Emissions | |||
|---|---|---|---|
| assigned to | total | average | ratio |
| persons 🙎♀️ | 46052 tonnes CO₂ | 578 g·CO₂/pax/n.mile | 100 % ⚙️ |
| freight 🚛 | 46052 tonnes CO₂ | N/A | 0.00002171468725942205 % ⚙️ |
| total | 46052 tonnes CO₂ | 497 kg·CO₂/n.mile | 100% |
| 2018 yearly statistics | |
|---|---|
| distance travelled | 171533 km ⚙️ |
| time at sea | 5799 hours |
| 2018 average statistics per journey | |
|---|---|
| average persons transported 🙎♀️ | 861 persons ⚙️ |
| average freight transported 🚛 | N/A |
| average speed | 30 km/h ⚙️ |
2018 monitoring methods:
N/A
2018 Theoretical
EIV (Efficiency Indicator Values): 5.27 gCO₂/ton/nautical mile
﹖ details
ℹ️
Figures with the icon ⚙️ were computed based on the published data.
You can find computation details on
this page ↗
GreenFerries is a hobby project, all the data shown here has no official value. It is Open Source, so you can double check and modify it.

The Ecoscore compares
average CO₂ emissions per passenger per km.
‟emits like 2.1 planes” means that the ferry emits more than twice what an average plane would on the same distance for one passenger.