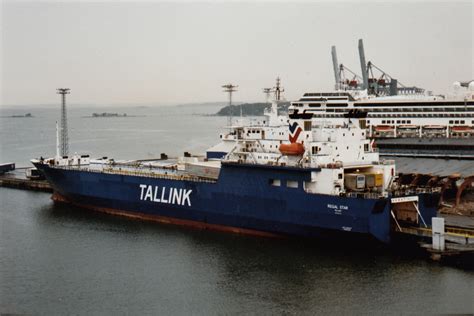
MS Regal Star

2 to 4 times an average plane's emissions
(based on 2022 data)
Often travels on 1 routes
- Paldiski [EE] ↔ Kapellskär [SE] - 284 km
⚠️
Do you know of a route that this ship frequently travels but is not listed? Or have you noticed an error?
Please help by letting us know, thank you 🙇🏽♀️
Please help by letting us know, thank you 🙇🏽♀️
Ship Statistics
| 2022 yearly CO₂ Emissions | |||
|---|---|---|---|
| assigned to | total | average | ratio |
| persons 🙎♀️ | 1371 tonnes CO₂ | 601 g·CO₂/pax/n.mile | 9 % ⚙️ |
| freight 🚛 | 10813 tonnes CO₂ | 168 kg·CO₂/m tonne/n.mile | 91 % ⚙️ |
| total | 15514 tonnes CO₂ | 350 kg·CO₂/n.mile | 100% |
| 2022 yearly statistics | |
|---|---|
| distance travelled | 82201 km ⚙️ |
| time at sea | 3311 hours |
| 2022 average statistics per journey | |
|---|---|
| average persons transported 🙎♀️ | 51 persons ⚙️ |
| average freight transported 🚛 | 1448 metric tons ⚙️ |
| average speed | 25 km/h ⚙️ |
2022 monitoring methods:
N/A
2022 Theoretical
EIV (Efficiency Indicator Values): 23.49 gCO₂/ton/nautical mile
﹖ details
| 2021 yearly CO₂ Emissions | |||
|---|---|---|---|
| assigned to | total | average | ratio |
| persons 🙎♀️ | 1462 tonnes CO₂ | 494 g·CO₂/pax/n.mile | 9 % ⚙️ |
| freight 🚛 | 11009 tonnes CO₂ | 144 kg·CO₂/m tonne/n.mile | 91 % ⚙️ |
| total | 16187 tonnes CO₂ | 339 kg·CO₂/n.mile | 100% |
| 2021 yearly statistics | |
|---|---|
| distance travelled | 88365 km ⚙️ |
| time at sea | 3317 hours |
| 2021 average statistics per journey | |
|---|---|
| average persons transported 🙎♀️ | 62 persons ⚙️ |
| average freight transported 🚛 | 1604 metric tons ⚙️ |
| average speed | 27 km/h ⚙️ |
2021 monitoring methods:
N/A
2021 Theoretical
EIV (Efficiency Indicator Values): 23.49 gCO₂/ton/nautical mile
﹖ details
| 2020 yearly CO₂ Emissions | |||
|---|---|---|---|
| assigned to | total | average | ratio |
| persons 🙎♀️ | 1863 tonnes CO₂ | 556 g·CO₂/pax/n.mile | 9 % ⚙️ |
| freight 🚛 | 14642 tonnes CO₂ | 174 kg·CO₂/m tonne/n.mile | 91 % ⚙️ |
| total | 19804 tonnes CO₂ | 310 kg·CO₂/n.mile | 100% |
| 2020 yearly statistics | |
|---|---|
| distance travelled | 118148 km ⚙️ |
| time at sea | 4424 hours |
| 2020 average statistics per journey | |
|---|---|
| average persons transported 🙎♀️ | 53 persons ⚙️ |
| average freight transported 🚛 | 1322 metric tons ⚙️ |
| average speed | 27 km/h ⚙️ |
2020 monitoring methods:
N/A
2020 Theoretical
EIV (Efficiency Indicator Values): 23.49 gCO₂/ton/nautical mile
﹖ details
| 2019 yearly CO₂ Emissions | |||
|---|---|---|---|
| assigned to | total | average | ratio |
| persons 🙎♀️ | 2125 tonnes CO₂ | 686 g·CO₂/pax/n.mile | 10 % ⚙️ |
| freight 🚛 | 17023 tonnes CO₂ | 199 kg·CO₂/m tonne/n.mile | 90 % ⚙️ |
| total | 21932 tonnes CO₂ | 292 kg·CO₂/n.mile | 100% |
| 2019 yearly statistics | |
|---|---|
| distance travelled | 138958 km ⚙️ |
| time at sea | 5140 hours |
| 2019 average statistics per journey | |
|---|---|
| average persons transported 🙎♀️ | 41 persons ⚙️ |
| average freight transported 🚛 | 1142 metric tons ⚙️ |
| average speed | 27 km/h ⚙️ |
2019 monitoring methods:
N/A
2019 Theoretical
EIV (Efficiency Indicator Values): 23.49 gCO₂/ton/nautical mile
﹖ details
| 2018 yearly CO₂ Emissions | |||
|---|---|---|---|
| assigned to | total | average | ratio |
| persons 🙎♀️ | 2165 tonnes CO₂ | 652 g·CO₂/pax/n.mile | 10 % ⚙️ |
| freight 🚛 | 17340 tonnes CO₂ | 187 kg·CO₂/m tonne/n.mile | 90 % ⚙️ |
| total | 21810 tonnes CO₂ | 290 kg·CO₂/n.mile | 100% |
| 2018 yearly statistics | |
|---|---|
| distance travelled | 139157 km ⚙️ |
| time at sea | 5120 hours |
| 2018 average statistics per journey | |
|---|---|
| average persons transported 🙎♀️ | 44 persons ⚙️ |
| average freight transported 🚛 | 1235 metric tons ⚙️ |
| average speed | 27 km/h ⚙️ |
2018 monitoring methods:
N/A
2018 Theoretical
EIV (Efficiency Indicator Values): 17.85 gCO₂/ton/nautical mile
﹖ details
ℹ️
Figures with the icon ⚙️ were computed based on the published data.
You can find computation details on
this page ↗
GreenFerries is a hobby project, all the data shown here has no official value. It is Open Source, so you can double check and modify it.

The Ecoscore compares
average CO₂ emissions per passenger per km.
‟emits like 2.1 planes” means that the ferry emits more than twice what an average plane would on the same distance for one passenger.