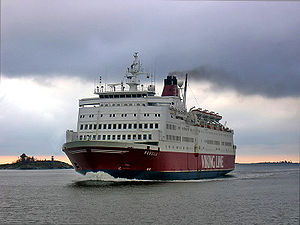
MS Rosella

2 to 4 times an average plane's emissions
(based on 2022 data)
Often travels on 1 routes
- Helsinki [FI] ↔ Tallinn [EE] - 82 km
⚠️
Do you know of a route that this ship frequently travels but is not listed? Or have you noticed an error?
Please help by letting us know, thank you 🙇🏽♀️
Please help by letting us know, thank you 🙇🏽♀️
Ship Statistics
| 2022 yearly CO₂ Emissions | |||
|---|---|---|---|
| assigned to | total | average | ratio |
| persons 🙎♀️ | 15193 tonnes CO₂ | 921 g·CO₂/pax/n.mile | 76 % ⚙️ |
| freight 🚛 | 2051 tonnes CO₂ | 1744 kg·CO₂/m tonne/n.mile | 24 % ⚙️ |
| total | 19949 tonnes CO₂ | 397 kg·CO₂/n.mile | 100% |
| 2022 yearly statistics | |
|---|---|
| distance travelled | 92971 km ⚙️ |
| time at sea | 3429 hours |
| 2022 average statistics per journey | |
|---|---|
| average persons transported 🙎♀️ | 329 persons ⚙️ |
| average freight transported 🚛 | 23 metric tons ⚙️ |
| average speed | 27 km/h ⚙️ |
2022 monitoring methods:
N/A
2022 Theoretical
EIV (Efficiency Indicator Values): 19 gCO₂/ton/nautical mile
﹖ details
| 2021 yearly CO₂ Emissions | |||
|---|---|---|---|
| assigned to | total | average | ratio |
| persons 🙎♀️ | 13230 tonnes CO₂ | 1067 g·CO₂/pax/n.mile | 65 % ⚙️ |
| freight 🚛 | 4487 tonnes CO₂ | 1869 kg·CO₂/m tonne/n.mile | 35 % ⚙️ |
| total | 20472 tonnes CO₂ | 381 kg·CO₂/n.mile | 100% |
| 2021 yearly statistics | |
|---|---|
| distance travelled | 99452 km ⚙️ |
| time at sea | 3683 hours |
| 2021 average statistics per journey | |
|---|---|
| average persons transported 🙎♀️ | 231 persons ⚙️ |
| average freight transported 🚛 | 45 metric tons ⚙️ |
| average speed | 27 km/h ⚙️ |
2021 monitoring methods:
N/A
2021 Theoretical
EIV (Efficiency Indicator Values): 19 gCO₂/ton/nautical mile
﹖ details
| 2020 yearly CO₂ Emissions | |||
|---|---|---|---|
| assigned to | total | average | ratio |
| persons 🙎♀️ | 6932 tonnes CO₂ | 828 g·CO₂/pax/n.mile | 43 % ⚙️ |
| freight 🚛 | 5829 tonnes CO₂ | 1487 kg·CO₂/m tonne/n.mile | 57 % ⚙️ |
| total | 16102 tonnes CO₂ | 445 kg·CO₂/n.mile | 100% |
| 2020 yearly statistics | |
|---|---|
| distance travelled | 67042 km ⚙️ |
| time at sea | 2498 hours |
| 2020 average statistics per journey | |
|---|---|
| average persons transported 🙎♀️ | 231 persons ⚙️ |
| average freight transported 🚛 | 108 metric tons ⚙️ |
| average speed | 27 km/h ⚙️ |
2020 monitoring methods:
N/A
2020 Theoretical
EIV (Efficiency Indicator Values): 19 gCO₂/ton/nautical mile
﹖ details
| 2019 yearly CO₂ Emissions | |||
|---|---|---|---|
| assigned to | total | average | ratio |
| persons 🙎♀️ | 17141 tonnes CO₂ | 642 g·CO₂/pax/n.mile | 73 % ⚙️ |
| freight 🚛 | 4002 tonnes CO₂ | 1461 kg·CO₂/m tonne/n.mile | 27 % ⚙️ |
| total | 23579 tonnes CO₂ | 406 kg·CO₂/n.mile | 100% |
| 2019 yearly statistics | |
|---|---|
| distance travelled | 107602 km ⚙️ |
| time at sea | 3851 hours |
| 2019 average statistics per journey | |
|---|---|
| average persons transported 🙎♀️ | 460 persons ⚙️ |
| average freight transported 🚛 | 47 metric tons ⚙️ |
| average speed | 28 km/h ⚙️ |
2019 monitoring methods:
N/A
2019 Theoretical
EIV (Efficiency Indicator Values): 19 gCO₂/ton/nautical mile
﹖ details
| 2018 yearly CO₂ Emissions | |||
|---|---|---|---|
| assigned to | total | average | ratio |
| persons 🙎♀️ | 16637 tonnes CO₂ | 637 g·CO₂/pax/n.mile | 71 % ⚙️ |
| freight 🚛 | 4033 tonnes CO₂ | 1420 kg·CO₂/m tonne/n.mile | 29 % ⚙️ |
| total | 23324 tonnes CO₂ | 397 kg·CO₂/n.mile | 100% |
| 2018 yearly statistics | |
|---|---|
| distance travelled | 108898 km ⚙️ |
| time at sea | 3914 hours |
| 2018 average statistics per journey | |
|---|---|
| average persons transported 🙎♀️ | 444 persons ⚙️ |
| average freight transported 🚛 | 48 metric tons ⚙️ |
| average speed | 28 km/h ⚙️ |
2018 monitoring methods:
N/A
2018 Theoretical
EIV (Efficiency Indicator Values): 19 gCO₂/ton/nautical mile
﹖ details
ℹ️
Figures with the icon ⚙️ were computed based on the published data.
You can find computation details on
this page ↗
GreenFerries is a hobby project, all the data shown here has no official value. It is Open Source, so you can double check and modify it.

The Ecoscore compares
average CO₂ emissions per passenger per km.
‟emits like 2.1 planes” means that the ferry emits more than twice what an average plane would on the same distance for one passenger.