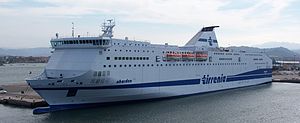
MS Sharden

2 to 4 times an average plane's emissions
(based on 2021 data)
Often travels on 1 routes
- Gênes [IT] ↔ Porto Torres [IT] - 399 km
⚠️
Do you know of a route that this ship frequently travels but is not listed? Or have you noticed an error?
Please help by letting us know, thank you 🙇🏽♀️
Please help by letting us know, thank you 🙇🏽♀️
Ship Statistics
| 2022 yearly CO₂ Emissions | |||
|---|---|---|---|
| assigned to | total | average | ratio |
| persons 🙎♀️ | N/A | N/A | N/A |
| freight 🚛 | N/A | N/A | N/A |
| total | N/A | N/A | 100% |
| 2022 yearly statistics | |
|---|---|
| distance travelled | N/A |
| time at sea | N/A |
| 2022 average statistics per journey | |
|---|---|
| average persons transported 🙎♀️ | N/A |
| average freight transported 🚛 | N/A |
| average speed | N/A |
2022 monitoring methods:
N/A
2022 Theoretical
N/A
﹖ details
| 2021 yearly CO₂ Emissions | |||
|---|---|---|---|
| assigned to | total | average | ratio |
| persons 🙎♀️ | 44434 tonnes CO₂ | 543 g·CO₂/pax/n.mile | 70 % ⚙️ |
| freight 🚛 | 19043 tonnes CO₂ | 78 kg·CO₂/m tonne/n.mile | 30 % ⚙️ |
| total | 63477 tonnes CO₂ | 815 kg·CO₂/n.mile | 100% |
| 2021 yearly statistics | |
|---|---|
| distance travelled | 144191 km ⚙️ |
| time at sea | 4055 hours |
| 2021 average statistics per journey | |
|---|---|
| average persons transported 🙎♀️ | 1051 persons ⚙️ |
| average freight transported 🚛 | 3152 metric tons ⚙️ |
| average speed | 36 km/h ⚙️ |
2021 monitoring methods:
N/A
2021 Theoretical
EIV (Efficiency Indicator Values): 9.72 gCO₂/ton/nautical mile
﹖ details
| 2020 yearly CO₂ Emissions | |||
|---|---|---|---|
| assigned to | total | average | ratio |
| persons 🙎♀️ | 35698 tonnes CO₂ | 545 g·CO₂/pax/n.mile | 69 % ⚙️ |
| freight 🚛 | 16038 tonnes CO₂ | 84 kg·CO₂/m tonne/n.mile | 31 % ⚙️ |
| total | 51736 tonnes CO₂ | 766 kg·CO₂/n.mile | 100% |
| 2020 yearly statistics | |
|---|---|
| distance travelled | 125017 km ⚙️ |
| time at sea | 3818 hours |
| 2020 average statistics per journey | |
|---|---|
| average persons transported 🙎♀️ | 970 persons ⚙️ |
| average freight transported 🚛 | 2829 metric tons ⚙️ |
| average speed | 33 km/h ⚙️ |
2020 monitoring methods:
N/A
2020 Theoretical
EIV (Efficiency Indicator Values): 9.72 gCO₂/ton/nautical mile
﹖ details
| 2019 yearly CO₂ Emissions | |||
|---|---|---|---|
| assigned to | total | average | ratio |
| persons 🙎♀️ | 37332 tonnes CO₂ | 845 g·CO₂/pax/n.mile | 77 % ⚙️ |
| freight 🚛 | 11151 tonnes CO₂ | 115 kg·CO₂/m tonne/n.mile | 23 % ⚙️ |
| total | 48483 tonnes CO₂ | 761 kg·CO₂/n.mile | 100% |
| 2019 yearly statistics | |
|---|---|
| distance travelled | 117954 km ⚙️ |
| time at sea | 3571 hours |
| 2019 average statistics per journey | |
|---|---|
| average persons transported 🙎♀️ | 694 persons ⚙️ |
| average freight transported 🚛 | 1528 metric tons ⚙️ |
| average speed | 33 km/h ⚙️ |
2019 monitoring methods:
N/A
2019 Theoretical
EIV (Efficiency Indicator Values): 9.72 gCO₂/ton/nautical mile
﹖ details
| 2018 yearly CO₂ Emissions | |||
|---|---|---|---|
| assigned to | total | average | ratio |
| persons 🙎♀️ | 38593 tonnes CO₂ | 825 g·CO₂/pax/n.mile | 76 % ⚙️ |
| freight 🚛 | 12187 tonnes CO₂ | 97 kg·CO₂/m tonne/n.mile | 24 % ⚙️ |
| total | 50780 tonnes CO₂ | 618 kg·CO₂/n.mile | 100% |
| 2018 yearly statistics | |
|---|---|
| distance travelled | 152190 km ⚙️ |
| time at sea | 4628 hours |
| 2018 average statistics per journey | |
|---|---|
| average persons transported 🙎♀️ | 569 persons ⚙️ |
| average freight transported 🚛 | 1525 metric tons ⚙️ |
| average speed | 33 km/h ⚙️ |
2018 monitoring methods:
N/A
2018 Theoretical
EIV (Efficiency Indicator Values): 9.72 gCO₂/ton/nautical mile
﹖ details
ℹ️
Figures with the icon ⚙️ were computed based on the published data.
You can find computation details on
this page ↗
GreenFerries is a hobby project, all the data shown here has no official value. It is Open Source, so you can double check and modify it.

The Ecoscore compares
average CO₂ emissions per passenger per km.
‟emits like 2.1 planes” means that the ferry emits more than twice what an average plane would on the same distance for one passenger.