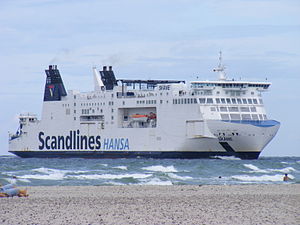
MS Skåne

2 to 4 times an average plane's emissions
(based on 2022 data)
Often travels on 1 routes
- Rostock [DE] ↔ Trelleborg [SE] - 157 km
⚠️
Do you know of a route that this ship frequently travels but is not listed? Or have you noticed an error?
Please help by letting us know, thank you 🙇🏽♀️
Please help by letting us know, thank you 🙇🏽♀️
Ship Statistics
| 2022 yearly CO₂ Emissions | |||
|---|---|---|---|
| assigned to | total | average | ratio |
| persons 🙎♀️ | 19674 tonnes CO₂ | 1030 g·CO₂/pax/n.mile | 51 % ⚙️ |
| freight 🚛 | 18580 tonnes CO₂ | 77 kg·CO₂/m tonne/n.mile | 49 % ⚙️ |
| total | 38254 tonnes CO₂ | 469 kg·CO₂/n.mile | 100% |
| 2022 yearly statistics | |
|---|---|
| distance travelled | 150974 km ⚙️ |
| time at sea | 6260 hours |
| 2022 average statistics per journey | |
|---|---|
| average persons transported 🙎♀️ | 234 persons ⚙️ |
| average freight transported 🚛 | 2944 metric tons ⚙️ |
| average speed | 24 km/h ⚙️ |
2022 monitoring methods:
N/A
2022 Theoretical
EIV (Efficiency Indicator Values): 30.03 gCO₂/ton/nautical mile
﹖ details
| 2021 yearly CO₂ Emissions | |||
|---|---|---|---|
| assigned to | total | average | ratio |
| persons 🙎♀️ | 22535 tonnes CO₂ | 1372 g·CO₂/pax/n.mile | 51 % ⚙️ |
| freight 🚛 | 21282 tonnes CO₂ | 78 kg·CO₂/m tonne/n.mile | 49 % ⚙️ |
| total | 43817 tonnes CO₂ | 529 kg·CO₂/n.mile | 100% |
| 2021 yearly statistics | |
|---|---|
| distance travelled | 153510 km ⚙️ |
| time at sea | 6297 hours |
| 2021 average statistics per journey | |
|---|---|
| average persons transported 🙎♀️ | 198 persons ⚙️ |
| average freight transported 🚛 | 3292 metric tons ⚙️ |
| average speed | 24 km/h ⚙️ |
2021 monitoring methods:
N/A
2021 Theoretical
EIV (Efficiency Indicator Values): 30.03 gCO₂/ton/nautical mile
﹖ details
| 2020 yearly CO₂ Emissions | |||
|---|---|---|---|
| assigned to | total | average | ratio |
| persons 🙎♀️ | 20492 tonnes CO₂ | 1659 g·CO₂/pax/n.mile | 53 % ⚙️ |
| freight 🚛 | 16105 tonnes CO₂ | 81 kg·CO₂/m tonne/n.mile | 47 % ⚙️ |
| total | 38974 tonnes CO₂ | 465 kg·CO₂/n.mile | 100% |
| 2020 yearly statistics | |
|---|---|
| distance travelled | 155194 km ⚙️ |
| time at sea | 6219 hours |
| 2020 average statistics per journey | |
|---|---|
| average persons transported 🙎♀️ | 147 persons ⚙️ |
| average freight transported 🚛 | 2384 metric tons ⚙️ |
| average speed | 25 km/h ⚙️ |
2020 monitoring methods:
N/A
2020 Theoretical
EIV (Efficiency Indicator Values): 21.83 gCO₂/ton/nautical mile
﹖ details
| 2019 yearly CO₂ Emissions | |||
|---|---|---|---|
| assigned to | total | average | ratio |
| persons 🙎♀️ | 21057 tonnes CO₂ | 1057 g·CO₂/pax/n.mile | 56 % ⚙️ |
| freight 🚛 | 14664 tonnes CO₂ | 83 kg·CO₂/m tonne/n.mile | 44 % ⚙️ |
| total | 37892 tonnes CO₂ | 463 kg·CO₂/n.mile | 100% |
| 2019 yearly statistics | |
|---|---|
| distance travelled | 151575 km ⚙️ |
| time at sea | 6421 hours |
| 2019 average statistics per journey | |
|---|---|
| average persons transported 🙎♀️ | 243 persons ⚙️ |
| average freight transported 🚛 | 2152 metric tons ⚙️ |
| average speed | 24 km/h ⚙️ |
2019 monitoring methods:
N/A
2019 Theoretical
N/A
﹖ details
| 2018 yearly CO₂ Emissions | |||
|---|---|---|---|
| assigned to | total | average | ratio |
| persons 🙎♀️ | 24826 tonnes CO₂ | 1236 g·CO₂/pax/n.mile | 62 % ⚙️ |
| freight 🚛 | 15536 tonnes CO₂ | 143 kg·CO₂/m tonne/n.mile | 38 % ⚙️ |
| total | 40362 tonnes CO₂ | 522 kg·CO₂/n.mile | 100% |
| 2018 yearly statistics | |
|---|---|
| distance travelled | 143073 km ⚙️ |
| time at sea | 5937 hours |
| 2018 average statistics per journey | |
|---|---|
| average persons transported 🙎♀️ | 260 persons ⚙️ |
| average freight transported 🚛 | 1406 metric tons ⚙️ |
| average speed | 24 km/h ⚙️ |
2018 monitoring methods:
N/A
2018 Theoretical
N/A
﹖ details
ℹ️
Figures with the icon ⚙️ were computed based on the published data.
You can find computation details on
this page ↗
GreenFerries is a hobby project, all the data shown here has no official value. It is Open Source, so you can double check and modify it.

The Ecoscore compares
average CO₂ emissions per passenger per km.
‟emits like 2.1 planes” means that the ferry emits more than twice what an average plane would on the same distance for one passenger.