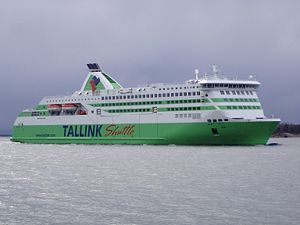
MS Star

2 to 4 times an average plane's emissions
(based on 2022 data)
Often travels on 1 routes
- Helsinki [FI] ↔ Tallinn [EE] - 82 km
⚠️
Do you know of a route that this ship frequently travels but is not listed? Or have you noticed an error?
Please help by letting us know, thank you 🙇🏽♀️
Please help by letting us know, thank you 🙇🏽♀️
Ship Statistics
| 2022 yearly CO₂ Emissions | |||
|---|---|---|---|
| assigned to | total | average | ratio |
| persons 🙎♀️ | 42280 tonnes CO₂ | 844 g·CO₂/pax/n.mile | 67 % ⚙️ |
| freight 🚛 | 15794 tonnes CO₂ | 103 kg·CO₂/m tonne/n.mile | 33 % ⚙️ |
| total | 63024 tonnes CO₂ | 729 kg·CO₂/n.mile | 100% |
| 2022 yearly statistics | |
|---|---|
| distance travelled | 160155 km ⚙️ |
| time at sea | 4424 hours |
| 2022 average statistics per journey | |
|---|---|
| average persons transported 🙎♀️ | 579 persons ⚙️ |
| average freight transported 🚛 | 1775 metric tons ⚙️ |
| average speed | 36 km/h ⚙️ |
2022 monitoring methods:
N/A
2022 Theoretical
EIV (Efficiency Indicator Values): 3.26 gCO₂/ton/nautical mile
﹖ details
| 2021 yearly CO₂ Emissions | |||
|---|---|---|---|
| assigned to | total | average | ratio |
| persons 🙎♀️ | 42451 tonnes CO₂ | 1514 g·CO₂/pax/n.mile | 66 % ⚙️ |
| freight 🚛 | 17091 tonnes CO₂ | 129 kg·CO₂/m tonne/n.mile | 34 % ⚙️ |
| total | 64479 tonnes CO₂ | 695 kg·CO₂/n.mile | 100% |
| 2021 yearly statistics | |
|---|---|
| distance travelled | 171773 km ⚙️ |
| time at sea | 4746 hours |
| 2021 average statistics per journey | |
|---|---|
| average persons transported 🙎♀️ | 302 persons ⚙️ |
| average freight transported 🚛 | 1425 metric tons ⚙️ |
| average speed | 36 km/h ⚙️ |
2021 monitoring methods:
N/A
2021 Theoretical
EIV (Efficiency Indicator Values): 3.26 gCO₂/ton/nautical mile
﹖ details
| 2020 yearly CO₂ Emissions | |||
|---|---|---|---|
| assigned to | total | average | ratio |
| persons 🙎♀️ | 42193 tonnes CO₂ | 1164 g·CO₂/pax/n.mile | 70 % ⚙️ |
| freight 🚛 | 12803 tonnes CO₂ | 124 kg·CO₂/m tonne/n.mile | 30 % ⚙️ |
| total | 60387 tonnes CO₂ | 727 kg·CO₂/n.mile | 100% |
| 2020 yearly statistics | |
|---|---|
| distance travelled | 153911 km ⚙️ |
| time at sea | 4129 hours |
| 2020 average statistics per journey | |
|---|---|
| average persons transported 🙎♀️ | 436 persons ⚙️ |
| average freight transported 🚛 | 1244 metric tons ⚙️ |
| average speed | 37 km/h ⚙️ |
2020 monitoring methods:
N/A
2020 Theoretical
EIV (Efficiency Indicator Values): 3.26 gCO₂/ton/nautical mile
﹖ details
| 2019 yearly CO₂ Emissions | |||
|---|---|---|---|
| assigned to | total | average | ratio |
| persons 🙎♀️ | 47978 tonnes CO₂ | 641 g·CO₂/pax/n.mile | 72 % ⚙️ |
| freight 🚛 | 12738 tonnes CO₂ | 98 kg·CO₂/m tonne/n.mile | 28 % ⚙️ |
| total | 66820 tonnes CO₂ | 729 kg·CO₂/n.mile | 100% |
| 2019 yearly statistics | |
|---|---|
| distance travelled | 169701 km ⚙️ |
| time at sea | 4688 hours |
| 2019 average statistics per journey | |
|---|---|
| average persons transported 🙎♀️ | 817 persons ⚙️ |
| average freight transported 🚛 | 1419 metric tons ⚙️ |
| average speed | 36 km/h ⚙️ |
2019 monitoring methods:
N/A
2019 Theoretical
EIV (Efficiency Indicator Values): 3.26 gCO₂/ton/nautical mile
﹖ details
| 2018 yearly CO₂ Emissions | |||
|---|---|---|---|
| assigned to | total | average | ratio |
| persons 🙎♀️ | 52105 tonnes CO₂ | 675 g·CO₂/pax/n.mile | 73 % ⚙️ |
| freight 🚛 | 14176 tonnes CO₂ | 101 kg·CO₂/m tonne/n.mile | 27 % ⚙️ |
| total | 71556 tonnes CO₂ | 752 kg·CO₂/n.mile | 100% |
| 2018 yearly statistics | |
|---|---|
| distance travelled | 176222 km ⚙️ |
| time at sea | 4883 hours |
| 2018 average statistics per journey | |
|---|---|
| average persons transported 🙎♀️ | 811 persons ⚙️ |
| average freight transported 🚛 | 1471 metric tons ⚙️ |
| average speed | 36 km/h ⚙️ |
2018 monitoring methods:
N/A
2018 Theoretical
EIV (Efficiency Indicator Values): 3.26 gCO₂/ton/nautical mile
﹖ details
ℹ️
Figures with the icon ⚙️ were computed based on the published data.
You can find computation details on
this page ↗
GreenFerries is a hobby project, all the data shown here has no official value. It is Open Source, so you can double check and modify it.

The Ecoscore compares
average CO₂ emissions per passenger per km.
‟emits like 2.1 planes” means that the ferry emits more than twice what an average plane would on the same distance for one passenger.