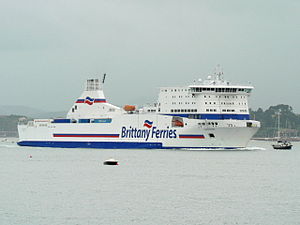
MS Stena Baltica

over 4 times an average plane's emissions
(based on 2022 data)
Often travels on 1 routes
- Gdynia [PL] ↔ Karlskrona [SE] - 261 km
⚠️
Do you know of a route that this ship frequently travels but is not listed? Or have you noticed an error?
Please help by letting us know, thank you 🙇🏽♀️
Please help by letting us know, thank you 🙇🏽♀️
Ship Statistics
| 2022 yearly CO₂ Emissions | |||
|---|---|---|---|
| assigned to | total | average | ratio |
| persons 🙎♀️ | 8839 tonnes CO₂ | 5342 g·CO₂/pax/n.mile | 29 % ⚙️ |
| freight 🚛 | 21906 tonnes CO₂ | 271 kg·CO₂/m tonne/n.mile | 71 % ⚙️ |
| total | 30746 tonnes CO₂ | 407 kg·CO₂/n.mile | 100% |
| 2022 yearly statistics | |
|---|---|
| distance travelled | 139835 km ⚙️ |
| time at sea | 4957 hours |
| 2022 average statistics per journey | |
|---|---|
| average persons transported 🙎♀️ | 22 persons ⚙️ |
| average freight transported 🚛 | 1071 metric tons ⚙️ |
| average speed | 28 km/h ⚙️ |
2022 monitoring methods:
N/A
2022 Theoretical
EIV (Efficiency Indicator Values): 24.67 gCO₂/ton/nautical mile
﹖ details
| 2021 yearly CO₂ Emissions | |||
|---|---|---|---|
| assigned to | total | average | ratio |
| persons 🙎♀️ | 42 tonnes CO₂ | 70 g·CO₂/pax/n.mile | 0.18286654088172136 % ⚙️ |
| freight 🚛 | 22674 tonnes CO₂ | 683 kg·CO₂/m tonne/n.mile | 100 % ⚙️ |
| total | 22716 tonnes CO₂ | 436 kg·CO₂/n.mile | 100% |
| 2021 yearly statistics | |
|---|---|
| distance travelled | 96575 km ⚙️ |
| time at sea | 3858 hours |
| 2021 average statistics per journey | |
|---|---|
| average persons transported 🙎♀️ | 11 persons ⚙️ |
| average freight transported 🚛 | 637 metric tons ⚙️ |
| average speed | 25 km/h ⚙️ |
2021 monitoring methods:
N/A
2021 Theoretical
EIV (Efficiency Indicator Values): 24.67 gCO₂/ton/nautical mile
﹖ details
| 2020 yearly CO₂ Emissions | |||
|---|---|---|---|
| assigned to | total | average | ratio |
| persons 🙎♀️ | 8253 tonnes CO₂ | 1379 g·CO₂/pax/n.mile | 28 % ⚙️ |
| freight 🚛 | 20886 tonnes CO₂ | 167 kg·CO₂/m tonne/n.mile | 72 % ⚙️ |
| total | 29138 tonnes CO₂ | 393 kg·CO₂/n.mile | 100% |
| 2020 yearly statistics | |
|---|---|
| distance travelled | 137254 km ⚙️ |
| time at sea | 4601 hours |
| 2020 average statistics per journey | |
|---|---|
| average persons transported 🙎♀️ | 81 persons ⚙️ |
| average freight transported 🚛 | 1692 metric tons ⚙️ |
| average speed | 30 km/h ⚙️ |
2020 monitoring methods:
N/A
2020 Theoretical
EIV (Efficiency Indicator Values): 24.67 gCO₂/ton/nautical mile
﹖ details
| 2019 yearly CO₂ Emissions | |||
|---|---|---|---|
| assigned to | total | average | ratio |
| persons 🙎♀️ | 9321 tonnes CO₂ | 804 g·CO₂/pax/n.mile | 24 % ⚙️ |
| freight 🚛 | 23454 tonnes CO₂ | 112 kg·CO₂/m tonne/n.mile | 76 % ⚙️ |
| total | 38598 tonnes CO₂ | 376 kg·CO₂/n.mile | 100% |
| 2019 yearly statistics | |
|---|---|
| distance travelled | 189963 km ⚙️ |
| time at sea | 6432 hours |
| 2019 average statistics per journey | |
|---|---|
| average persons transported 🙎♀️ | 113 persons ⚙️ |
| average freight transported 🚛 | 2040 metric tons ⚙️ |
| average speed | 30 km/h ⚙️ |
2019 monitoring methods:
N/A
2019 Theoretical
N/A
﹖ details
| 2018 yearly CO₂ Emissions | |||
|---|---|---|---|
| assigned to | total | average | ratio |
| persons 🙎♀️ | 14723 tonnes CO₂ | 1159 g·CO₂/pax/n.mile | 39 % ⚙️ |
| freight 🚛 | 22656 tonnes CO₂ | 107 kg·CO₂/m tonne/n.mile | 61 % ⚙️ |
| total | 37379 tonnes CO₂ | 362 kg·CO₂/n.mile | 100% |
| 2018 yearly statistics | |
|---|---|
| distance travelled | 191322 km ⚙️ |
| time at sea | 6709 hours |
| 2018 average statistics per journey | |
|---|---|
| average persons transported 🙎♀️ | 123 persons ⚙️ |
| average freight transported 🚛 | 2047 metric tons ⚙️ |
| average speed | 29 km/h ⚙️ |
2018 monitoring methods:
N/A
2018 Theoretical
N/A
﹖ details
ℹ️
Figures with the icon ⚙️ were computed based on the published data.
You can find computation details on
this page ↗
GreenFerries is a hobby project, all the data shown here has no official value. It is Open Source, so you can double check and modify it.

The Ecoscore compares
average CO₂ emissions per passenger per km.
‟emits like 2.1 planes” means that the ferry emits more than twice what an average plane would on the same distance for one passenger.