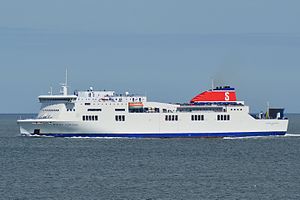
MS Stena Horizon

2 to 4 times an average plane's emissions
(based on 2022 data)
Often travels on 1 routes
- Cherbourg [FR] ↔ Rosslare [IE] - 444 km
⚠️
Do you know of a route that this ship frequently travels but is not listed? Or have you noticed an error?
Please help by letting us know, thank you 🙇🏽♀️
Please help by letting us know, thank you 🙇🏽♀️
Ship Statistics
| 2022 yearly CO₂ Emissions | |||
|---|---|---|---|
| assigned to | total | average | ratio |
| persons 🙎♀️ | 12364 tonnes CO₂ | 561 g·CO₂/pax/n.mile | 31 % ⚙️ |
| freight 🚛 | 27520 tonnes CO₂ | 168 kg·CO₂/m tonne/n.mile | 69 % ⚙️ |
| total | 39884 tonnes CO₂ | 479 kg·CO₂/n.mile | 100% |
| 2022 yearly statistics | |
|---|---|
| distance travelled | 154152 km ⚙️ |
| time at sea | 4661 hours |
| 2022 average statistics per journey | |
|---|---|
| average persons transported 🙎♀️ | 265 persons ⚙️ |
| average freight transported 🚛 | 1969 metric tons ⚙️ |
| average speed | 33 km/h ⚙️ |
2022 monitoring methods:
N/A
2022 Theoretical
EIV (Efficiency Indicator Values): 21.2 gCO₂/ton/nautical mile
﹖ details
| 2021 yearly CO₂ Emissions | |||
|---|---|---|---|
| assigned to | total | average | ratio |
| persons 🙎♀️ | 13393 tonnes CO₂ | 1075 g·CO₂/pax/n.mile | 31 % ⚙️ |
| freight 🚛 | 29811 tonnes CO₂ | 168 kg·CO₂/m tonne/n.mile | 69 % ⚙️ |
| total | 43204 tonnes CO₂ | 485 kg·CO₂/n.mile | 100% |
| 2021 yearly statistics | |
|---|---|
| distance travelled | 165065 km ⚙️ |
| time at sea | 5077 hours |
| 2021 average statistics per journey | |
|---|---|
| average persons transported 🙎♀️ | 140 persons ⚙️ |
| average freight transported 🚛 | 1996 metric tons ⚙️ |
| average speed | 33 km/h ⚙️ |
2021 monitoring methods:
N/A
2021 Theoretical
EIV (Efficiency Indicator Values): 21.2 gCO₂/ton/nautical mile
﹖ details
| 2020 yearly CO₂ Emissions | |||
|---|---|---|---|
| assigned to | total | average | ratio |
| persons 🙎♀️ | 14891 tonnes CO₂ | 1624 g·CO₂/pax/n.mile | 35 % ⚙️ |
| freight 🚛 | 24625 tonnes CO₂ | 171 kg·CO₂/m tonne/n.mile | 65 % ⚙️ |
| total | 42149 tonnes CO₂ | 508 kg·CO₂/n.mile | 100% |
| 2020 yearly statistics | |
|---|---|
| distance travelled | 153537 km ⚙️ |
| time at sea | 4861 hours |
| 2020 average statistics per journey | |
|---|---|
| average persons transported 🙎♀️ | 111 persons ⚙️ |
| average freight transported 🚛 | 1741 metric tons ⚙️ |
| average speed | 32 km/h ⚙️ |
2020 monitoring methods:
N/A
2020 Theoretical
EIV (Efficiency Indicator Values): 29.75 gCO₂/ton/nautical mile
﹖ details
| 2019 yearly CO₂ Emissions | |||
|---|---|---|---|
| assigned to | total | average | ratio |
| persons 🙎♀️ | 19623 tonnes CO₂ | 720 g·CO₂/pax/n.mile | 42 % ⚙️ |
| freight 🚛 | 24966 tonnes CO₂ | 104 kg·CO₂/m tonne/n.mile | 58 % ⚙️ |
| total | 46740 tonnes CO₂ | 489 kg·CO₂/n.mile | 100% |
| 2019 yearly statistics | |
|---|---|
| distance travelled | 177037 km ⚙️ |
| time at sea | 5384 hours |
| 2019 average statistics per journey | |
|---|---|
| average persons transported 🙎♀️ | 285 persons ⚙️ |
| average freight transported 🚛 | 2516 metric tons ⚙️ |
| average speed | 33 km/h ⚙️ |
2019 monitoring methods:
N/A
2019 Theoretical
N/A
﹖ details
| 2018 yearly CO₂ Emissions | |||
|---|---|---|---|
| assigned to | total | average | ratio |
| persons 🙎♀️ | 24568 tonnes CO₂ | 954 g·CO₂/pax/n.mile | 51 % ⚙️ |
| freight 🚛 | 23758 tonnes CO₂ | 98 kg·CO₂/m tonne/n.mile | 49 % ⚙️ |
| total | 48326 tonnes CO₂ | 460 kg·CO₂/n.mile | 100% |
| 2018 yearly statistics | |
|---|---|
| distance travelled | 194776 km ⚙️ |
| time at sea | 5960 hours |
| 2018 average statistics per journey | |
|---|---|
| average persons transported 🙎♀️ | 245 persons ⚙️ |
| average freight transported 🚛 | 2309 metric tons ⚙️ |
| average speed | 33 km/h ⚙️ |
2018 monitoring methods:
N/A
2018 Theoretical
N/A
﹖ details
ℹ️
Figures with the icon ⚙️ were computed based on the published data.
You can find computation details on
this page ↗
GreenFerries is a hobby project, all the data shown here has no official value. It is Open Source, so you can double check and modify it.

The Ecoscore compares
average CO₂ emissions per passenger per km.
‟emits like 2.1 planes” means that the ferry emits more than twice what an average plane would on the same distance for one passenger.