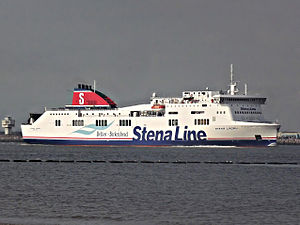
MS Stena Lagan

2 to 4 times an average plane's emissions
(based on 2022 data)
Often travels on 1 routes
⚠️
Do you know of a route that this ship frequently travels but is not listed? Or have you noticed an error?
Please help by letting us know, thank you 🙇🏽♀️
Please help by letting us know, thank you 🙇🏽♀️
Ship Statistics
| 2022 yearly CO₂ Emissions | |||
|---|---|---|---|
| assigned to | total | average | ratio |
| persons 🙎♀️ | 10307 tonnes CO₂ | 589 g·CO₂/pax/n.mile | 33 % ⚙️ |
| freight 🚛 | 21164 tonnes CO₂ | 158 kg·CO₂/m tonne/n.mile | 67 % ⚙️ |
| total | 31471 tonnes CO₂ | 472 kg·CO₂/n.mile | 100% |
| 2022 yearly statistics | |
|---|---|
| distance travelled | 123425 km ⚙️ |
| time at sea | 4204 hours |
| 2022 average statistics per journey | |
|---|---|
| average persons transported 🙎♀️ | 262 persons ⚙️ |
| average freight transported 🚛 | 2015 metric tons ⚙️ |
| average speed | 29 km/h ⚙️ |
2022 monitoring methods:
N/A
2022 Theoretical
EIV (Efficiency Indicator Values): 19.31 gCO₂/ton/nautical mile
﹖ details
| 2021 yearly CO₂ Emissions | |||
|---|---|---|---|
| assigned to | total | average | ratio |
| persons 🙎♀️ | 5478 tonnes CO₂ | 590 g·CO₂/pax/n.mile | 33 % ⚙️ |
| freight 🚛 | 11248 tonnes CO₂ | 143 kg·CO₂/m tonne/n.mile | 67 % ⚙️ |
| total | 16725 tonnes CO₂ | 426 kg·CO₂/n.mile | 100% |
| 2021 yearly statistics | |
|---|---|
| distance travelled | 72634 km ⚙️ |
| time at sea | 2391 hours |
| 2021 average statistics per journey | |
|---|---|
| average persons transported 🙎♀️ | 237 persons ⚙️ |
| average freight transported 🚛 | 2009 metric tons ⚙️ |
| average speed | 30 km/h ⚙️ |
2021 monitoring methods:
N/A
2021 Theoretical
EIV (Efficiency Indicator Values): 19.31 gCO₂/ton/nautical mile
﹖ details
| 2020 yearly CO₂ Emissions | |||
|---|---|---|---|
| assigned to | total | average | ratio |
| persons 🙎♀️ | 5809 tonnes CO₂ | 1997 g·CO₂/pax/n.mile | 64 % ⚙️ |
| freight 🚛 | 2795 tonnes CO₂ | 56 kg·CO₂/m tonne/n.mile | 36 % ⚙️ |
| total | 9064 tonnes CO₂ | 496 kg·CO₂/n.mile | 100% |
| 2020 yearly statistics | |
|---|---|
| distance travelled | 33827 km ⚙️ |
| time at sea | 1055 hours |
| 2020 average statistics per journey | |
|---|---|
| average persons transported 🙎♀️ | 159 persons ⚙️ |
| average freight transported 🚛 | 2735 metric tons ⚙️ |
| average speed | 32 km/h ⚙️ |
2020 monitoring methods:
N/A
2020 Theoretical
EIV (Efficiency Indicator Values): 25.43 gCO₂/ton/nautical mile
﹖ details
| 2019 yearly CO₂ Emissions | |||
|---|---|---|---|
| assigned to | total | average | ratio |
| persons 🙎♀️ | 29401 tonnes CO₂ | 1260 g·CO₂/pax/n.mile | 64 % ⚙️ |
| freight 🚛 | 13642 tonnes CO₂ | 44 kg·CO₂/m tonne/n.mile | 36 % ⚙️ |
| total | 45687 tonnes CO₂ | 484 kg·CO₂/n.mile | 100% |
| 2019 yearly statistics | |
|---|---|
| distance travelled | 174853 km ⚙️ |
| time at sea | 5418 hours |
| 2019 average statistics per journey | |
|---|---|
| average persons transported 🙎♀️ | 247 persons ⚙️ |
| average freight transported 🚛 | 3251 metric tons ⚙️ |
| average speed | 32 km/h ⚙️ |
2019 monitoring methods:
N/A
2019 Theoretical
N/A
﹖ details
| 2018 yearly CO₂ Emissions | |||
|---|---|---|---|
| assigned to | total | average | ratio |
| persons 🙎♀️ | 33159 tonnes CO₂ | 1488 g·CO₂/pax/n.mile | 71 % ⚙️ |
| freight 🚛 | 13239 tonnes CO₂ | 44 kg·CO₂/m tonne/n.mile | 29 % ⚙️ |
| total | 46398 tonnes CO₂ | 484 kg·CO₂/n.mile | 100% |
| 2018 yearly statistics | |
|---|---|
| distance travelled | 177697 km ⚙️ |
| time at sea | 5638 hours |
| 2018 average statistics per journey | |
|---|---|
| average persons transported 🙎♀️ | 232 persons ⚙️ |
| average freight transported 🚛 | 3167 metric tons ⚙️ |
| average speed | 32 km/h ⚙️ |
2018 monitoring methods:
N/A
2018 Theoretical
N/A
﹖ details
ℹ️
Figures with the icon ⚙️ were computed based on the published data.
You can find computation details on
this page ↗
GreenFerries is a hobby project, all the data shown here has no official value. It is Open Source, so you can double check and modify it.

The Ecoscore compares
average CO₂ emissions per passenger per km.
‟emits like 2.1 planes” means that the ferry emits more than twice what an average plane would on the same distance for one passenger.