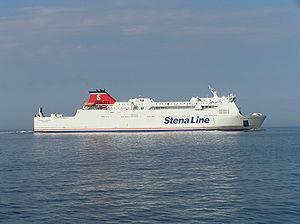
MS Stena Nordica

over 4 times an average plane's emissions
(based on 2022 data)
Often travels on 1 routes
- Gdynia [PL] ↔ Karlskrona [SE] - 261 km
⚠️
Do you know of a route that this ship frequently travels but is not listed? Or have you noticed an error?
Please help by letting us know, thank you 🙇🏽♀️
Please help by letting us know, thank you 🙇🏽♀️
Ship Statistics
| 2022 yearly CO₂ Emissions | |||
|---|---|---|---|
| assigned to | total | average | ratio |
| persons 🙎♀️ | 12723 tonnes CO₂ | 1625 g·CO₂/pax/n.mile | 31 % ⚙️ |
| freight 🚛 | 28320 tonnes CO₂ | 194 kg·CO₂/m tonne/n.mile | 69 % ⚙️ |
| total | 41043 tonnes CO₂ | 465 kg·CO₂/n.mile | 100% |
| 2022 yearly statistics | |
|---|---|
| distance travelled | 163382 km ⚙️ |
| time at sea | 5525 hours |
| 2022 average statistics per journey | |
|---|---|
| average persons transported 🙎♀️ | 89 persons ⚙️ |
| average freight transported 🚛 | 1656 metric tons ⚙️ |
| average speed | 30 km/h ⚙️ |
2022 monitoring methods:
N/A
2022 Theoretical
EIV (Efficiency Indicator Values): 22.88 gCO₂/ton/nautical mile
﹖ details
| 2021 yearly CO₂ Emissions | |||
|---|---|---|---|
| assigned to | total | average | ratio |
| persons 🙎♀️ | 12053 tonnes CO₂ | 1481 g·CO₂/pax/n.mile | 31 % ⚙️ |
| freight 🚛 | 26828 tonnes CO₂ | 169 kg·CO₂/m tonne/n.mile | 69 % ⚙️ |
| total | 38881 tonnes CO₂ | 413 kg·CO₂/n.mile | 100% |
| 2021 yearly statistics | |
|---|---|
| distance travelled | 174278 km ⚙️ |
| time at sea | 5945 hours |
| 2021 average statistics per journey | |
|---|---|
| average persons transported 🙎♀️ | 86 persons ⚙️ |
| average freight transported 🚛 | 1687 metric tons ⚙️ |
| average speed | 29 km/h ⚙️ |
2021 monitoring methods:
N/A
2021 Theoretical
EIV (Efficiency Indicator Values): 22.88 gCO₂/ton/nautical mile
﹖ details
| 2020 yearly CO₂ Emissions | |||
|---|---|---|---|
| assigned to | total | average | ratio |
| persons 🙎♀️ | 8314 tonnes CO₂ | 2121 g·CO₂/pax/n.mile | 29 % ⚙️ |
| freight 🚛 | 16657 tonnes CO₂ | 231 kg·CO₂/m tonne/n.mile | 71 % ⚙️ |
| total | 29153 tonnes CO₂ | 576 kg·CO₂/n.mile | 100% |
| 2020 yearly statistics | |
|---|---|
| distance travelled | 93816 km ⚙️ |
| time at sea | 2982 hours |
| 2020 average statistics per journey | |
|---|---|
| average persons transported 🙎♀️ | 77 persons ⚙️ |
| average freight transported 🚛 | 1426 metric tons ⚙️ |
| average speed | 31 km/h ⚙️ |
2020 monitoring methods:
N/A
2020 Theoretical
EIV (Efficiency Indicator Values): 25.52 gCO₂/ton/nautical mile
﹖ details
| 2019 yearly CO₂ Emissions | |||
|---|---|---|---|
| assigned to | total | average | ratio |
| persons 🙎♀️ | 14419 tonnes CO₂ | 1151 g·CO₂/pax/n.mile | 40 % ⚙️ |
| freight 🚛 | 17191 tonnes CO₂ | 276 kg·CO₂/m tonne/n.mile | 60 % ⚙️ |
| total | 36277 tonnes CO₂ | 621 kg·CO₂/n.mile | 100% |
| 2019 yearly statistics | |
|---|---|
| distance travelled | 108265 km ⚙️ |
| time at sea | 3883 hours |
| 2019 average statistics per journey | |
|---|---|
| average persons transported 🙎♀️ | 214 persons ⚙️ |
| average freight transported 🚛 | 1066 metric tons ⚙️ |
| average speed | 28 km/h ⚙️ |
2019 monitoring methods:
N/A
2019 Theoretical
N/A
﹖ details
| 2018 yearly CO₂ Emissions | |||
|---|---|---|---|
| assigned to | total | average | ratio |
| persons 🙎♀️ | 14800 tonnes CO₂ | 1561 g·CO₂/pax/n.mile | 41 % ⚙️ |
| freight 🚛 | 21033 tonnes CO₂ | 252 kg·CO₂/m tonne/n.mile | 59 % ⚙️ |
| total | 35833 tonnes CO₂ | 395 kg·CO₂/n.mile | 100% |
| 2018 yearly statistics | |
|---|---|
| distance travelled | 168075 km ⚙️ |
| time at sea | 6185 hours |
| 2018 average statistics per journey | |
|---|---|
| average persons transported 🙎♀️ | 104 persons ⚙️ |
| average freight transported 🚛 | 921 metric tons ⚙️ |
| average speed | 27 km/h ⚙️ |
2018 monitoring methods:
N/A
2018 Theoretical
N/A
﹖ details
ℹ️
Figures with the icon ⚙️ were computed based on the published data.
You can find computation details on
this page ↗
GreenFerries is a hobby project, all the data shown here has no official value. It is Open Source, so you can double check and modify it.

The Ecoscore compares
average CO₂ emissions per passenger per km.
‟emits like 2.1 planes” means that the ferry emits more than twice what an average plane would on the same distance for one passenger.