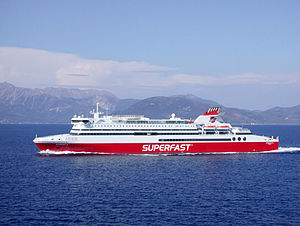
MS Superfast XI

better than riding a car with a single passenger
(based on 2022 data)
Often travels on 2 routes
- Ancona [IT] ↔ Igoumenitsa [GR] - 723 km
- Ancona [IT] ↔ Patras [GR] - 912 km
⚠️
Do you know of a route that this ship frequently travels but is not listed? Or have you noticed an error?
Please help by letting us know, thank you 🙇🏽♀️
Please help by letting us know, thank you 🙇🏽♀️
Ship Statistics
| 2022 yearly CO₂ Emissions | |||
|---|---|---|---|
| assigned to | total | average | ratio |
| persons 🙎♀️ | 18273 tonnes CO₂ | 261 g·CO₂/pax/n.mile | 18 % ⚙️ |
| freight 🚛 | 85602 tonnes CO₂ | 291 kg·CO₂/m tonne/n.mile | 82 % ⚙️ |
| total | 103876 tonnes CO₂ | 938 kg·CO₂/n.mile | 100% |
| 2022 yearly statistics | |
|---|---|
| distance travelled | 205072 km ⚙️ |
| time at sea | 4564 hours |
| 2022 average statistics per journey | |
|---|---|
| average persons transported 🙎♀️ | 632 persons ⚙️ |
| average freight transported 🚛 | 2658 metric tons ⚙️ |
| average speed | 45 km/h ⚙️ |
2022 monitoring methods:
N/A
2022 Theoretical
EIV (Efficiency Indicator Values): 24.03 gCO₂/ton/nautical mile
﹖ details
| 2021 yearly CO₂ Emissions | |||
|---|---|---|---|
| assigned to | total | average | ratio |
| persons 🙎♀️ | 14495 tonnes CO₂ | 277 g·CO₂/pax/n.mile | 13 % ⚙️ |
| freight 🚛 | 100975 tonnes CO₂ | 323 kg·CO₂/m tonne/n.mile | 87 % ⚙️ |
| total | 115470 tonnes CO₂ | 948 kg·CO₂/n.mile | 100% |
| 2021 yearly statistics | |
|---|---|
| distance travelled | 225506 km ⚙️ |
| time at sea | 5112 hours |
| 2021 average statistics per journey | |
|---|---|
| average persons transported 🙎♀️ | 430 persons ⚙️ |
| average freight transported 🚛 | 2564 metric tons ⚙️ |
| average speed | 44 km/h ⚙️ |
2021 monitoring methods:
N/A
2021 Theoretical
EIV (Efficiency Indicator Values): 24.03 gCO₂/ton/nautical mile
﹖ details
| 2020 yearly CO₂ Emissions | |||
|---|---|---|---|
| assigned to | total | average | ratio |
| persons 🙎♀️ | 7112 tonnes CO₂ | 265 g·CO₂/pax/n.mile | 9 % ⚙️ |
| freight 🚛 | 72484 tonnes CO₂ | 344 kg·CO₂/m tonne/n.mile | 91 % ⚙️ |
| total | 79597 tonnes CO₂ | 941 kg·CO₂/n.mile | 100% |
| 2020 yearly statistics | |
|---|---|
| distance travelled | 156684 km ⚙️ |
| time at sea | 3572 hours |
| 2020 average statistics per journey | |
|---|---|
| average persons transported 🙎♀️ | 317 persons ⚙️ |
| average freight transported 🚛 | 2492 metric tons ⚙️ |
| average speed | 44 km/h ⚙️ |
2020 monitoring methods:
N/A
2020 Theoretical
EIV (Efficiency Indicator Values): 24.03 gCO₂/ton/nautical mile
﹖ details
| 2019 yearly CO₂ Emissions | |||
|---|---|---|---|
| assigned to | total | average | ratio |
| persons 🙎♀️ | 15438 tonnes CO₂ | 213 g·CO₂/pax/n.mile | 13 % ⚙️ |
| freight 🚛 | 105113 tonnes CO₂ | 287 kg·CO₂/m tonne/n.mile | 87 % ⚙️ |
| total | 120551 tonnes CO₂ | 883 kg·CO₂/n.mile | 100% |
| 2019 yearly statistics | |
|---|---|
| distance travelled | 252812 km ⚙️ |
| time at sea | 5737 hours |
| 2019 average statistics per journey | |
|---|---|
| average persons transported 🙎♀️ | 531 persons ⚙️ |
| average freight transported 🚛 | 2683 metric tons ⚙️ |
| average speed | 44 km/h ⚙️ |
2019 monitoring methods:
N/A
2019 Theoretical
EIV (Efficiency Indicator Values): 24.03 gCO₂/ton/nautical mile
﹖ details
| 2018 yearly CO₂ Emissions | |||
|---|---|---|---|
| assigned to | total | average | ratio |
| persons 🙎♀️ | 17987 tonnes CO₂ | 230 g·CO₂/pax/n.mile | 13 % ⚙️ |
| freight 🚛 | 127027 tonnes CO₂ | 267 kg·CO₂/m tonne/n.mile | 87 % ⚙️ |
| total | 140372 tonnes CO₂ | 942 kg·CO₂/n.mile | 100% |
| 2018 yearly statistics | |
|---|---|
| distance travelled | 276087 km ⚙️ |
| time at sea | 6224 hours |
| 2018 average statistics per journey | |
|---|---|
| average persons transported 🙎♀️ | 525 persons ⚙️ |
| average freight transported 🚛 | 3186 metric tons ⚙️ |
| average speed | 44 km/h ⚙️ |
2018 monitoring methods:
N/A
2018 Theoretical
EIV (Efficiency Indicator Values): 24.03 gCO₂/ton/nautical mile
﹖ details
ℹ️
Figures with the icon ⚙️ were computed based on the published data.
You can find computation details on
this page ↗
GreenFerries is a hobby project, all the data shown here has no official value. It is Open Source, so you can double check and modify it.

The Ecoscore compares
average CO₂ emissions per passenger per km.
‟emits like 2.1 planes” means that the ferry emits more than twice what an average plane would on the same distance for one passenger.