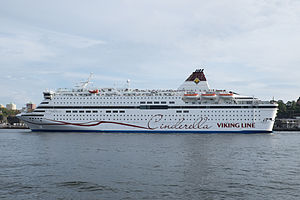
MS Viking Cinderella

better than riding a car with a single passenger
(based on 2022 data)
Often travels on 2 routes
- Stockholm [SE] ↔ Mariehamn [AX] - 135 km
- Stockholm [SE] ↔ Riga [LV] - 442 km
⚠️
Do you know of a route that this ship frequently travels but is not listed? Or have you noticed an error?
Please help by letting us know, thank you 🙇🏽♀️
Please help by letting us know, thank you 🙇🏽♀️
Ship Statistics
| 2022 yearly CO₂ Emissions | |||
|---|---|---|---|
| assigned to | total | average | ratio |
| persons 🙎♀️ | 17752 tonnes CO₂ | 276 g·CO₂/pax/n.mile | 62 % ⚙️ |
| freight 🚛 | 7970 tonnes CO₂ | 762 kg·CO₂/m tonne/n.mile | 38 % ⚙️ |
| total | 28810 tonnes CO₂ | 426 kg·CO₂/n.mile | 100% |
| 2022 yearly statistics | |
|---|---|
| distance travelled | 125195 km ⚙️ |
| time at sea | 6580 hours |
| 2022 average statistics per journey | |
|---|---|
| average persons transported 🙎♀️ | 951 persons ⚙️ |
| average freight transported 🚛 | 155 metric tons ⚙️ |
| average speed | 19 km/h ⚙️ |
2022 monitoring methods:
N/A
2022 Theoretical
EIV (Efficiency Indicator Values): 18 gCO₂/ton/nautical mile
﹖ details
| 2021 yearly CO₂ Emissions | |||
|---|---|---|---|
| assigned to | total | average | ratio |
| persons 🙎♀️ | 11445 tonnes CO₂ | 320 g·CO₂/pax/n.mile | 49 % ⚙️ |
| freight 🚛 | 7598 tonnes CO₂ | 824 kg·CO₂/m tonne/n.mile | 51 % ⚙️ |
| total | 23276 tonnes CO₂ | 491 kg·CO₂/n.mile | 100% |
| 2021 yearly statistics | |
|---|---|
| distance travelled | 87784 km ⚙️ |
| time at sea | 4455 hours |
| 2021 average statistics per journey | |
|---|---|
| average persons transported 🙎♀️ | 755 persons ⚙️ |
| average freight transported 🚛 | 195 metric tons ⚙️ |
| average speed | 20 km/h ⚙️ |
2021 monitoring methods:
N/A
2021 Theoretical
EIV (Efficiency Indicator Values): 18 gCO₂/ton/nautical mile
﹖ details
| 2020 yearly CO₂ Emissions | |||
|---|---|---|---|
| assigned to | total | average | ratio |
| persons 🙎♀️ | 8980 tonnes CO₂ | 458 g·CO₂/pax/n.mile | 61 % ⚙️ |
| freight 🚛 | 533 tonnes CO₂ | 1752 kg·CO₂/m tonne/n.mile | 39 % ⚙️ |
| total | 14766 tonnes CO₂ | 551 kg·CO₂/n.mile | 100% |
| 2020 yearly statistics | |
|---|---|
| distance travelled | 49634 km ⚙️ |
| time at sea | 2928 hours |
| 2020 average statistics per journey | |
|---|---|
| average persons transported 🙎♀️ | 731 persons ⚙️ |
| average freight transported 🚛 | 11 metric tons ⚙️ |
| average speed | 17 km/h ⚙️ |
2020 monitoring methods:
N/A
2020 Theoretical
EIV (Efficiency Indicator Values): 18 gCO₂/ton/nautical mile
﹖ details
| 2019 yearly CO₂ Emissions | |||
|---|---|---|---|
| assigned to | total | average | ratio |
| persons 🙎♀️ | 20450 tonnes CO₂ | 307 g·CO₂/pax/n.mile | 85 % ⚙️ |
| freight 🚛 | 567 tonnes CO₂ | 1241 kg·CO₂/m tonne/n.mile | 15 % ⚙️ |
| total | 23963 tonnes CO₂ | 412 kg·CO₂/n.mile | 100% |
| 2019 yearly statistics | |
|---|---|
| distance travelled | 107601 km ⚙️ |
| time at sea | 6437 hours |
| 2019 average statistics per journey | |
|---|---|
| average persons transported 🙎♀️ | 1146 persons ⚙️ |
| average freight transported 🚛 | 8 metric tons ⚙️ |
| average speed | 17 km/h ⚙️ |
2019 monitoring methods:
N/A
2019 Theoretical
EIV (Efficiency Indicator Values): 18 gCO₂/ton/nautical mile
﹖ details
| 2018 yearly CO₂ Emissions | |||
|---|---|---|---|
| assigned to | total | average | ratio |
| persons 🙎♀️ | 21427 tonnes CO₂ | 297 g·CO₂/pax/n.mile | 86 % ⚙️ |
| freight 🚛 | 492 tonnes CO₂ | 975 kg·CO₂/m tonne/n.mile | 14 % ⚙️ |
| total | 24893 tonnes CO₂ | 407 kg·CO₂/n.mile | 100% |
| 2018 yearly statistics | |
|---|---|
| distance travelled | 113158 km ⚙️ |
| time at sea | 6846 hours |
| 2018 average statistics per journey | |
|---|---|
| average persons transported 🙎♀️ | 1182 persons ⚙️ |
| average freight transported 🚛 | 8 metric tons ⚙️ |
| average speed | 17 km/h ⚙️ |
2018 monitoring methods:
N/A
2018 Theoretical
EIV (Efficiency Indicator Values): 18 gCO₂/ton/nautical mile
﹖ details
ℹ️
Figures with the icon ⚙️ were computed based on the published data.
You can find computation details on
this page ↗
GreenFerries is a hobby project, all the data shown here has no official value. It is Open Source, so you can double check and modify it.

The Ecoscore compares
average CO₂ emissions per passenger per km.
‟emits like 2.1 planes” means that the ferry emits more than twice what an average plane would on the same distance for one passenger.