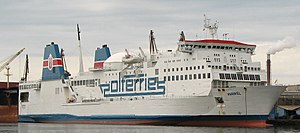
MS Wawel

better than riding a car with two passengers
(based on 2022 data)
Often travels on 1 routes
- Ystad [SE] ↔ Świnoujście [PL] - 171 km
⚠️
Do you know of a route that this ship frequently travels but is not listed? Or have you noticed an error?
Please help by letting us know, thank you 🙇🏽♀️
Please help by letting us know, thank you 🙇🏽♀️
Ship Statistics
| 2022 yearly CO₂ Emissions | |||
|---|---|---|---|
| assigned to | total | average | ratio |
| persons 🙎♀️ | 3158 tonnes CO₂ | 147 g·CO₂/pax/n.mile | 10 % ⚙️ |
| freight 🚛 | 30086 tonnes CO₂ | 253 kg·CO₂/m tonne/n.mile | 90 % ⚙️ |
| total | 33244 tonnes CO₂ | 389 kg·CO₂/n.mile | 100% |
| 2022 yearly statistics | |
|---|---|
| distance travelled | 158418 km ⚙️ |
| time at sea | 5350 hours |
| 2022 average statistics per journey | |
|---|---|
| average persons transported 🙎♀️ | 252 persons ⚙️ |
| average freight transported 🚛 | 1390 metric tons ⚙️ |
| average speed | 30 km/h ⚙️ |
2022 monitoring methods:
N/A
2022 Theoretical
EIV (Efficiency Indicator Values): 51.21 gCO₂/ton/nautical mile
﹖ details
| 2021 yearly CO₂ Emissions | |||
|---|---|---|---|
| assigned to | total | average | ratio |
| persons 🙎♀️ | 3273 tonnes CO₂ | 160 g·CO₂/pax/n.mile | 9 % ⚙️ |
| freight 🚛 | 31178 tonnes CO₂ | 254 kg·CO₂/m tonne/n.mile | 91 % ⚙️ |
| total | 34451 tonnes CO₂ | 412 kg·CO₂/n.mile | 100% |
| 2021 yearly statistics | |
|---|---|
| distance travelled | 154715 km ⚙️ |
| time at sea | 5221 hours |
| 2021 average statistics per journey | |
|---|---|
| average persons transported 🙎♀️ | 245 persons ⚙️ |
| average freight transported 🚛 | 1469 metric tons ⚙️ |
| average speed | 30 km/h ⚙️ |
2021 monitoring methods:
N/A
2021 Theoretical
EIV (Efficiency Indicator Values): 51.21 gCO₂/ton/nautical mile
﹖ details
| 2020 yearly CO₂ Emissions | |||
|---|---|---|---|
| assigned to | total | average | ratio |
| persons 🙎♀️ | 3135 tonnes CO₂ | 198 g·CO₂/pax/n.mile | 9 % ⚙️ |
| freight 🚛 | 29862 tonnes CO₂ | 283 kg·CO₂/m tonne/n.mile | 91 % ⚙️ |
| total | 32997 tonnes CO₂ | 481 kg·CO₂/n.mile | 100% |
| 2020 yearly statistics | |
|---|---|
| distance travelled | 126959 km ⚙️ |
| time at sea | 5122 hours |
| 2020 average statistics per journey | |
|---|---|
| average persons transported 🙎♀️ | 231 persons ⚙️ |
| average freight transported 🚛 | 1537 metric tons ⚙️ |
| average speed | 25 km/h ⚙️ |
2020 monitoring methods:
N/A
2020 Theoretical
EIV (Efficiency Indicator Values): 51.21 gCO₂/ton/nautical mile
﹖ details
| 2019 yearly CO₂ Emissions | |||
|---|---|---|---|
| assigned to | total | average | ratio |
| persons 🙎♀️ | 3431 tonnes CO₂ | 190 g·CO₂/pax/n.mile | 10 % ⚙️ |
| freight 🚛 | 32686 tonnes CO₂ | 313 kg·CO₂/m tonne/n.mile | 90 % ⚙️ |
| total | 36117 tonnes CO₂ | 499 kg·CO₂/n.mile | 100% |
| 2019 yearly statistics | |
|---|---|
| distance travelled | 134110 km ⚙️ |
| time at sea | 5392 hours |
| 2019 average statistics per journey | |
|---|---|
| average persons transported 🙎♀️ | 249 persons ⚙️ |
| average freight transported 🚛 | 1442 metric tons ⚙️ |
| average speed | 25 km/h ⚙️ |
2019 monitoring methods:
N/A
2019 Theoretical
EIV (Efficiency Indicator Values): 51.21 gCO₂/ton/nautical mile
﹖ details
| 2018 yearly CO₂ Emissions | |||
|---|---|---|---|
| assigned to | total | average | ratio |
| persons 🙎♀️ | 3355 tonnes CO₂ | N/A | 9 % ⚙️ |
| freight 🚛 | 31962 tonnes CO₂ | 244 kg·CO₂/m tonne/n.mile | 91 % ⚙️ |
| total | 35318 tonnes CO₂ | 494 kg·CO₂/n.mile | 100% |
| 2018 yearly statistics | |
|---|---|
| distance travelled | 132330 km ⚙️ |
| time at sea | 5509 hours |
| 2018 average statistics per journey | |
|---|---|
| average persons transported 🙎♀️ | N/A |
| average freight transported 🚛 | 1837 metric tons ⚙️ |
| average speed | 24 km/h ⚙️ |
2018 monitoring methods:
N/A
2018 Theoretical
EIV (Efficiency Indicator Values): 51.21 gCO₂/ton/nautical mile
﹖ details
ℹ️
Figures with the icon ⚙️ were computed based on the published data.
You can find computation details on
this page ↗
GreenFerries is a hobby project, all the data shown here has no official value. It is Open Source, so you can double check and modify it.

The Ecoscore compares
average CO₂ emissions per passenger per km.
‟emits like 2.1 planes” means that the ferry emits more than twice what an average plane would on the same distance for one passenger.