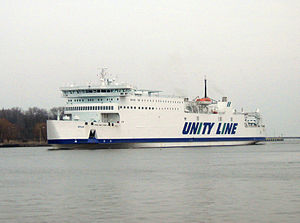
MS Wolin

over 4 times an average plane's emissions
(based on 2022 data)
Often travels on 2 routes
- Trelleborg [SE] ↔ Świnoujście [PL] - 177 km
- Ystad [SE] ↔ Świnoujście [PL] - 171 km
⚠️
Do you know of a route that this ship frequently travels but is not listed? Or have you noticed an error?
Please help by letting us know, thank you 🙇🏽♀️
Please help by letting us know, thank you 🙇🏽♀️
Ship Statistics
| 2022 yearly CO₂ Emissions | |||
|---|---|---|---|
| assigned to | total | average | ratio |
| persons 🙎♀️ | 18493 tonnes CO₂ | 5130 g·CO₂/pax/n.mile | 75 % ⚙️ |
| freight 🚛 | 6164 tonnes CO₂ | 228 kg·CO₂/m tonne/n.mile | 25 % ⚙️ |
| total | 24658 tonnes CO₂ | 356 kg·CO₂/n.mile | 100% |
| 2022 yearly statistics | |
|---|---|
| distance travelled | 128318 km ⚙️ |
| time at sea | 5556 hours |
| 2022 average statistics per journey | |
|---|---|
| average persons transported 🙎♀️ | 52 persons ⚙️ |
| average freight transported 🚛 | 390 metric tons ⚙️ |
| average speed | 23 km/h ⚙️ |
2022 monitoring methods:
N/A
2022 Theoretical
EIV (Efficiency Indicator Values): 16.84 gCO₂/ton/nautical mile
﹖ details
| 2021 yearly CO₂ Emissions | |||
|---|---|---|---|
| assigned to | total | average | ratio |
| persons 🙎♀️ | 17878 tonnes CO₂ | 5120 g·CO₂/pax/n.mile | 75 % ⚙️ |
| freight 🚛 | 5959 tonnes CO₂ | 229 kg·CO₂/m tonne/n.mile | 25 % ⚙️ |
| total | 23837 tonnes CO₂ | 361 kg·CO₂/n.mile | 100% |
| 2021 yearly statistics | |
|---|---|
| distance travelled | 122330 km ⚙️ |
| time at sea | 5289 hours |
| 2021 average statistics per journey | |
|---|---|
| average persons transported 🙎♀️ | 53 persons ⚙️ |
| average freight transported 🚛 | 395 metric tons ⚙️ |
| average speed | 23 km/h ⚙️ |
2021 monitoring methods:
N/A
2021 Theoretical
EIV (Efficiency Indicator Values): 16.84 gCO₂/ton/nautical mile
﹖ details
| 2020 yearly CO₂ Emissions | |||
|---|---|---|---|
| assigned to | total | average | ratio |
| persons 🙎♀️ | 6177 tonnes CO₂ | 2655 g·CO₂/pax/n.mile | 25 % ⚙️ |
| freight 🚛 | 18531 tonnes CO₂ | 130 kg·CO₂/m tonne/n.mile | 75 % ⚙️ |
| total | 24708 tonnes CO₂ | 357 kg·CO₂/n.mile | 100% |
| 2020 yearly statistics | |
|---|---|
| distance travelled | 128136 km ⚙️ |
| time at sea | 5648 hours |
| 2020 average statistics per journey | |
|---|---|
| average persons transported 🙎♀️ | 34 persons ⚙️ |
| average freight transported 🚛 | 2059 metric tons ⚙️ |
| average speed | 23 km/h ⚙️ |
2020 monitoring methods:
N/A
2020 Theoretical
EIV (Efficiency Indicator Values): 36.84 gCO₂/ton/nautical mile
﹖ details
| 2019 yearly CO₂ Emissions | |||
|---|---|---|---|
| assigned to | total | average | ratio |
| persons 🙎♀️ | 5747 tonnes CO₂ | 1958 g·CO₂/pax/n.mile | 25 % ⚙️ |
| freight 🚛 | 17240 tonnes CO₂ | 165 kg·CO₂/m tonne/n.mile | 75 % ⚙️ |
| total | 22987 tonnes CO₂ | 351 kg·CO₂/n.mile | 100% |
| 2019 yearly statistics | |
|---|---|
| distance travelled | 121162 km ⚙️ |
| time at sea | 5190 hours |
| 2019 average statistics per journey | |
|---|---|
| average persons transported 🙎♀️ | 45 persons ⚙️ |
| average freight transported 🚛 | 1598 metric tons ⚙️ |
| average speed | 23 km/h ⚙️ |
2019 monitoring methods:
N/A
2019 Theoretical
EIV (Efficiency Indicator Values): 36.84 gCO₂/ton/nautical mile
﹖ details
| 2018 yearly CO₂ Emissions | |||
|---|---|---|---|
| assigned to | total | average | ratio |
| persons 🙎♀️ | 5740 tonnes CO₂ | 1945 g·CO₂/pax/n.mile | 25 % ⚙️ |
| freight 🚛 | 17220 tonnes CO₂ | 116 kg·CO₂/m tonne/n.mile | 75 % ⚙️ |
| total | 22960 tonnes CO₂ | 329 kg·CO₂/n.mile | 100% |
| 2018 yearly statistics | |
|---|---|
| distance travelled | 129227 km ⚙️ |
| time at sea | 5739 hours |
| 2018 average statistics per journey | |
|---|---|
| average persons transported 🙎♀️ | 42 persons ⚙️ |
| average freight transported 🚛 | 2134 metric tons ⚙️ |
| average speed | 23 km/h ⚙️ |
2018 monitoring methods:
N/A
2018 Theoretical
EIV (Efficiency Indicator Values): 16.84 gCO₂/ton/nautical mile
﹖ details
ℹ️
Figures with the icon ⚙️ were computed based on the published data.
You can find computation details on
this page ↗
GreenFerries is a hobby project, all the data shown here has no official value. It is Open Source, so you can double check and modify it.

The Ecoscore compares
average CO₂ emissions per passenger per km.
‟emits like 2.1 planes” means that the ferry emits more than twice what an average plane would on the same distance for one passenger.