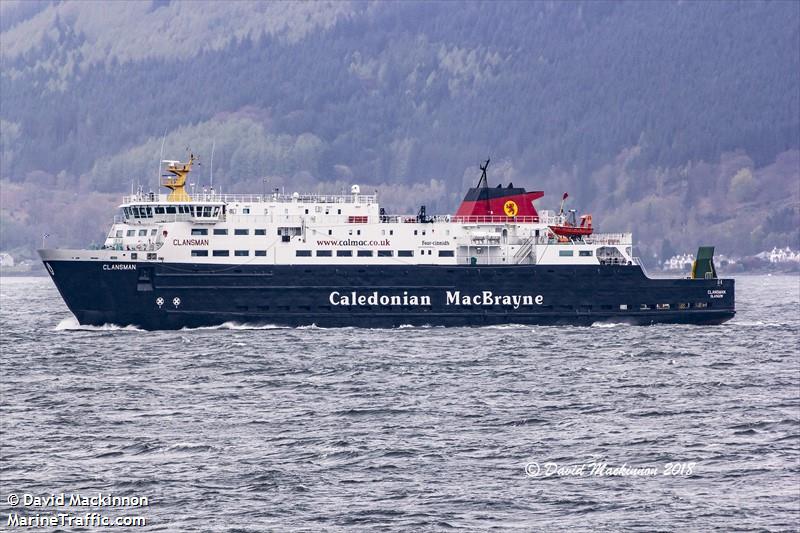
MV Clansman

better than riding a car with two passengers
(based on 2020 data)
Often travels on 4 routes
- Oban [GB] ↔ Castlebay [GB] - 137 km
- Oban [GB] ↔ Coll [GB] - 70 km
- Oban [GB] ↔ Colonsay [GB] - 58 km
- Oban [GB] ↔ Scarinish [GB] - 82 km
⚠️
Do you know of a route that this ship frequently travels but is not listed? Or have you noticed an error?
Please help by letting us know, thank you 🙇🏽♀️
Please help by letting us know, thank you 🙇🏽♀️
Ship Statistics
| 2022 yearly CO₂ Emissions | |||
|---|---|---|---|
| assigned to | total | average | ratio |
| persons 🙎♀️ | N/A | N/A | N/A |
| freight 🚛 | N/A | N/A | N/A |
| total | N/A | N/A | 100% |
| 2022 yearly statistics | |
|---|---|
| distance travelled | N/A |
| time at sea | N/A |
| 2022 average statistics per journey | |
|---|---|
| average persons transported 🙎♀️ | N/A |
| average freight transported 🚛 | N/A |
| average speed | N/A |
2022 monitoring methods:
N/A
2022 Theoretical
N/A
﹖ details
| 2021 yearly CO₂ Emissions | |||
|---|---|---|---|
| assigned to | total | average | ratio |
| persons 🙎♀️ | N/A | N/A | N/A |
| freight 🚛 | N/A | N/A | N/A |
| total | N/A | N/A | 100% |
| 2021 yearly statistics | |
|---|---|
| distance travelled | N/A |
| time at sea | N/A |
| 2021 average statistics per journey | |
|---|---|
| average persons transported 🙎♀️ | N/A |
| average freight transported 🚛 | N/A |
| average speed | N/A |
2021 monitoring methods:
N/A
2021 Theoretical
N/A
﹖ details
| 2020 yearly CO₂ Emissions | |||
|---|---|---|---|
| assigned to | total | average | ratio |
| persons 🙎♀️ | 3917 tonnes CO₂ | 3 g·CO₂/pax/n.mile | 43 % ⚙️ |
| freight 🚛 | 5169 tonnes CO₂ | 2 kg·CO₂/m tonne/n.mile | 57 % ⚙️ |
| total | 9087 tonnes CO₂ | 268 kg·CO₂/n.mile | 100% |
| 2020 yearly statistics | |
|---|---|
| distance travelled | 62762 km ⚙️ |
| time at sea | 2337 hours |
| 2020 average statistics per journey | |
|---|---|
| average persons transported 🙎♀️ | 41581 persons ⚙️ |
| average freight transported 🚛 | 74771 metric tons ⚙️ |
| average speed | 27 km/h ⚙️ |
2020 monitoring methods:
N/A
2020 Theoretical
EIV (Efficiency Indicator Values): 68.81 gCO₂/ton/nautical mile
﹖ details
| 2019 yearly CO₂ Emissions | |||
|---|---|---|---|
| assigned to | total | average | ratio |
| persons 🙎♀️ | 5825 tonnes CO₂ | 2 g·CO₂/pax/n.mile | 49 % ⚙️ |
| freight 🚛 | 5300 tonnes CO₂ | 2 kg·CO₂/m tonne/n.mile | 51 % ⚙️ |
| total | 11932 tonnes CO₂ | 246 kg·CO₂/n.mile | 100% |
| 2019 yearly statistics | |
|---|---|
| distance travelled | 89650 km ⚙️ |
| time at sea | 3367 hours |
| 2019 average statistics per journey | |
|---|---|
| average persons transported 🙎♀️ | 61713 persons ⚙️ |
| average freight transported 🚛 | 56151 metric tons ⚙️ |
| average speed | 27 km/h ⚙️ |
2019 monitoring methods:
N/A
2019 Theoretical
N/A
﹖ details
| 2018 yearly CO₂ Emissions | |||
|---|---|---|---|
| assigned to | total | average | ratio |
| persons 🙎♀️ | 4899 tonnes CO₂ | 2 g·CO₂/pax/n.mile | 52 % ⚙️ |
| freight 🚛 | 3752 tonnes CO₂ | 2 kg·CO₂/m tonne/n.mile | 48 % ⚙️ |
| total | 9336 tonnes CO₂ | 204 kg·CO₂/n.mile | 100% |
| 2018 yearly statistics | |
|---|---|
| distance travelled | 84865 km ⚙️ |
| time at sea | 2755 hours |
| 2018 average statistics per journey | |
|---|---|
| average persons transported 🙎♀️ | 48600 persons ⚙️ |
| average freight transported 🚛 | 37221 metric tons ⚙️ |
| average speed | 31 km/h ⚙️ |
2018 monitoring methods:
N/A
2018 Theoretical
N/A
﹖ details
ℹ️
Figures with the icon ⚙️ were computed based on the published data.
You can find computation details on
this page ↗
GreenFerries is a hobby project, all the data shown here has no official value. It is Open Source, so you can double check and modify it.

The Ecoscore compares
average CO₂ emissions per passenger per km.
‟emits like 2.1 planes” means that the ferry emits more than twice what an average plane would on the same distance for one passenger.