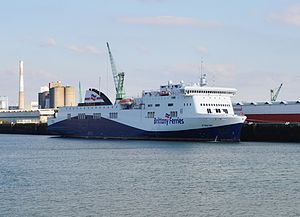
MV Étretat

2 to 4 times an average plane's emissions
(based on 2022 data)
Often travels on 1 routes
- Le Havre [FR] ↔ Portsmouth [GB] - 170 km
⚠️
Do you know of a route that this ship frequently travels but is not listed? Or have you noticed an error?
Please help by letting us know, thank you 🙇🏽♀️
Please help by letting us know, thank you 🙇🏽♀️
Ship Statistics
| 2022 yearly CO₂ Emissions | |||
|---|---|---|---|
| assigned to | total | average | ratio |
| persons 🙎♀️ | 14223 tonnes CO₂ | 876 g·CO₂/pax/n.mile | 30 % ⚙️ |
| freight 🚛 | 33504 tonnes CO₂ | 107 kg·CO₂/m tonne/n.mile | 70 % ⚙️ |
| total | 47727 tonnes CO₂ | 439 kg·CO₂/n.mile | 100% |
| 2022 yearly statistics | |
|---|---|
| distance travelled | 201242 km ⚙️ |
| time at sea | 5596 hours |
| 2022 average statistics per journey | |
|---|---|
| average persons transported 🙎♀️ | 149 persons ⚙️ |
| average freight transported 🚛 | 2879 metric tons ⚙️ |
| average speed | 36 km/h ⚙️ |
2022 monitoring methods:
N/A
2022 Theoretical
EIV (Efficiency Indicator Values): 21.17 gCO₂/ton/nautical mile
﹖ details
| 2021 yearly CO₂ Emissions | |||
|---|---|---|---|
| assigned to | total | average | ratio |
| persons 🙎♀️ | 12902 tonnes CO₂ | 1397 g·CO₂/pax/n.mile | 30 % ⚙️ |
| freight 🚛 | 30393 tonnes CO₂ | 153 kg·CO₂/m tonne/n.mile | 70 % ⚙️ |
| total | 43295 tonnes CO₂ | 469 kg·CO₂/n.mile | 100% |
| 2021 yearly statistics | |
|---|---|
| distance travelled | 170794 km ⚙️ |
| time at sea | 5267 hours |
| 2021 average statistics per journey | |
|---|---|
| average persons transported 🙎♀️ | 100 persons ⚙️ |
| average freight transported 🚛 | 2156 metric tons ⚙️ |
| average speed | 32 km/h ⚙️ |
2021 monitoring methods:
N/A
2021 Theoretical
EIV (Efficiency Indicator Values): 21.17 gCO₂/ton/nautical mile
﹖ details
| 2020 yearly CO₂ Emissions | |||
|---|---|---|---|
| assigned to | total | average | ratio |
| persons 🙎♀️ | 439 tonnes CO₂ | 877 g·CO₂/pax/n.mile | 7 % ⚙️ |
| freight 🚛 | 6258 tonnes CO₂ | 1142 kg·CO₂/m tonne/n.mile | 93 % ⚙️ |
| total | 6697 tonnes CO₂ | 1046 kg·CO₂/n.mile | 100% |
| 2020 yearly statistics | |
|---|---|
| distance travelled | 11858 km ⚙️ |
| time at sea | 501 hours |
| 2020 average statistics per journey | |
|---|---|
| average persons transported 🙎♀️ | 78 persons ⚙️ |
| average freight transported 🚛 | 856 metric tons ⚙️ |
| average speed | 24 km/h ⚙️ |
2020 monitoring methods:
N/A
2020 Theoretical
EIV (Efficiency Indicator Values): 21.17 gCO₂/ton/nautical mile
﹖ details
| 2019 yearly CO₂ Emissions | |||
|---|---|---|---|
| assigned to | total | average | ratio |
| persons 🙎♀️ | 6122 tonnes CO₂ | 388 g·CO₂/pax/n.mile | 14 % ⚙️ |
| freight 🚛 | 36231 tonnes CO₂ | 457 kg·CO₂/m tonne/n.mile | 86 % ⚙️ |
| total | 42354 tonnes CO₂ | 488 kg·CO₂/n.mile | 100% |
| 2019 yearly statistics | |
|---|---|
| distance travelled | 160677 km ⚙️ |
| time at sea | 5956 hours |
| 2019 average statistics per journey | |
|---|---|
| average persons transported 🙎♀️ | 182 persons ⚙️ |
| average freight transported 🚛 | 915 metric tons ⚙️ |
| average speed | 27 km/h ⚙️ |
2019 monitoring methods:
N/A
2019 Theoretical
EIV (Efficiency Indicator Values): 21.17 gCO₂/ton/nautical mile
﹖ details
| 2018 yearly CO₂ Emissions | |||
|---|---|---|---|
| assigned to | total | average | ratio |
| persons 🙎♀️ | 2780 tonnes CO₂ | 247 g·CO₂/pax/n.mile | 10 % ⚙️ |
| freight 🚛 | 25074 tonnes CO₂ | 319 kg·CO₂/m tonne/n.mile | 90 % ⚙️ |
| total | 27854 tonnes CO₂ | 499 kg·CO₂/n.mile | 100% |
| 2018 yearly statistics | |
|---|---|
| distance travelled | 103278 km ⚙️ |
| time at sea | 4476 hours |
| 2018 average statistics per journey | |
|---|---|
| average persons transported 🙎♀️ | 201 persons ⚙️ |
| average freight transported 🚛 | 1410 metric tons ⚙️ |
| average speed | 23 km/h ⚙️ |
2018 monitoring methods:
N/A
2018 Theoretical
EIV (Efficiency Indicator Values): 21.17 gCO₂/ton/nautical mile
﹖ details
ℹ️
Figures with the icon ⚙️ were computed based on the published data.
You can find computation details on
this page ↗
GreenFerries is a hobby project, all the data shown here has no official value. It is Open Source, so you can double check and modify it.

The Ecoscore compares
average CO₂ emissions per passenger per km.
‟emits like 2.1 planes” means that the ferry emits more than twice what an average plane would on the same distance for one passenger.