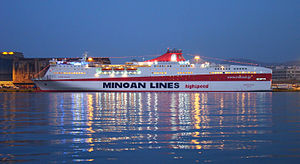
MV Festos Palace

over 4 times an average plane's emissions
(based on 2022 data)
Often travels on 1 routes
- Héraklion [GR] ↔ Le Pirée [GR] - 320 km
⚠️
Do you know of a route that this ship frequently travels but is not listed? Or have you noticed an error?
Please help by letting us know, thank you 🙇🏽♀️
Please help by letting us know, thank you 🙇🏽♀️
Ship Statistics
| 2022 yearly CO₂ Emissions | |||
|---|---|---|---|
| assigned to | total | average | ratio |
| persons 🙎♀️ | 37144 tonnes CO₂ | 1202 g·CO₂/pax/n.mile | 80 % ⚙️ |
| freight 🚛 | 9286 tonnes CO₂ | 108 kg·CO₂/m tonne/n.mile | 20 % ⚙️ |
| total | 46431 tonnes CO₂ | 824 kg·CO₂/n.mile | 100% |
| 2022 yearly statistics | |
|---|---|
| distance travelled | 104384 km ⚙️ |
| time at sea | 2828 hours |
| 2022 average statistics per journey | |
|---|---|
| average persons transported 🙎♀️ | 548 persons ⚙️ |
| average freight transported 🚛 | 1532 metric tons ⚙️ |
| average speed | 37 km/h ⚙️ |
2022 monitoring methods:
N/A
2022 Theoretical
EIV (Efficiency Indicator Values): 21.13 gCO₂/ton/nautical mile
﹖ details
| 2021 yearly CO₂ Emissions | |||
|---|---|---|---|
| assigned to | total | average | ratio |
| persons 🙎♀️ | 40704 tonnes CO₂ | 1465 g·CO₂/pax/n.mile | 80 % ⚙️ |
| freight 🚛 | 10176 tonnes CO₂ | 93 kg·CO₂/m tonne/n.mile | 20 % ⚙️ |
| total | 50880 tonnes CO₂ | 901 kg·CO₂/n.mile | 100% |
| 2021 yearly statistics | |
|---|---|
| distance travelled | 104544 km ⚙️ |
| time at sea | 2525 hours |
| 2021 average statistics per journey | |
|---|---|
| average persons transported 🙎♀️ | 492 persons ⚙️ |
| average freight transported 🚛 | 1948 metric tons ⚙️ |
| average speed | 41 km/h ⚙️ |
2021 monitoring methods:
N/A
2021 Theoretical
EIV (Efficiency Indicator Values): 21.13 gCO₂/ton/nautical mile
﹖ details
| 2020 yearly CO₂ Emissions | |||
|---|---|---|---|
| assigned to | total | average | ratio |
| persons 🙎♀️ | 61315 tonnes CO₂ | 1773 g·CO₂/pax/n.mile | 80 % ⚙️ |
| freight 🚛 | 15329 tonnes CO₂ | 115 kg·CO₂/m tonne/n.mile | 20 % ⚙️ |
| total | 76644 tonnes CO₂ | 863 kg·CO₂/n.mile | 100% |
| 2020 yearly statistics | |
|---|---|
| distance travelled | 164411 km ⚙️ |
| time at sea | 3870 hours |
| 2020 average statistics per journey | |
|---|---|
| average persons transported 🙎♀️ | 389 persons ⚙️ |
| average freight transported 🚛 | 1504 metric tons ⚙️ |
| average speed | 42 km/h ⚙️ |
2020 monitoring methods:
N/A
2020 Theoretical
EIV (Efficiency Indicator Values): 21.13 gCO₂/ton/nautical mile
﹖ details
| 2019 yearly CO₂ Emissions | |||
|---|---|---|---|
| assigned to | total | average | ratio |
| persons 🙎♀️ | 2564 tonnes CO₂ | 40 g·CO₂/pax/n.mile | 4 % ⚙️ |
| freight 🚛 | 57441 tonnes CO₂ | 390 kg·CO₂/m tonne/n.mile | 96 % ⚙️ |
| total | 60004 tonnes CO₂ | 797 kg·CO₂/n.mile | 100% |
| 2019 yearly statistics | |
|---|---|
| distance travelled | 139517 km ⚙️ |
| time at sea | 3657 hours |
| 2019 average statistics per journey | |
|---|---|
| average persons transported 🙎♀️ | 848 persons ⚙️ |
| average freight transported 🚛 | 1956 metric tons ⚙️ |
| average speed | 38 km/h ⚙️ |
2019 monitoring methods:
N/A
2019 Theoretical
EIV (Efficiency Indicator Values): 21.13 gCO₂/ton/nautical mile
﹖ details
| 2018 yearly CO₂ Emissions | |||
|---|---|---|---|
| assigned to | total | average | ratio |
| persons 🙎♀️ | 2557 tonnes CO₂ | 42 g·CO₂/pax/n.mile | 5 % ⚙️ |
| freight 🚛 | 53886 tonnes CO₂ | 421 kg·CO₂/m tonne/n.mile | 95 % ⚙️ |
| total | 56444 tonnes CO₂ | 831 kg·CO₂/n.mile | 100% |
| 2018 yearly statistics | |
|---|---|
| distance travelled | 125771 km ⚙️ |
| time at sea | 3245 hours |
| 2018 average statistics per journey | |
|---|---|
| average persons transported 🙎♀️ | 896 persons ⚙️ |
| average freight transported 🚛 | 1885 metric tons ⚙️ |
| average speed | 39 km/h ⚙️ |
2018 monitoring methods:
N/A
2018 Theoretical
EIV (Efficiency Indicator Values): 21.13 gCO₂/ton/nautical mile
﹖ details
ℹ️
Figures with the icon ⚙️ were computed based on the published data.
You can find computation details on
this page ↗
GreenFerries is a hobby project, all the data shown here has no official value. It is Open Source, so you can double check and modify it.

The Ecoscore compares
average CO₂ emissions per passenger per km.
‟emits like 2.1 planes” means that the ferry emits more than twice what an average plane would on the same distance for one passenger.