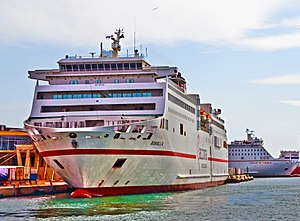
MV Sorolla

better than riding a car with a single passenger
(based on 2022 data)
Often travels on 2 routes
- Almeria [ES] ↔ Melilla [ES] - 177 km
- Málaga [ES] ↔ Melilla [ES] - 207 km
⚠️
Do you know of a route that this ship frequently travels but is not listed? Or have you noticed an error?
Please help by letting us know, thank you 🙇🏽♀️
Please help by letting us know, thank you 🙇🏽♀️
Ship Statistics
| 2022 yearly CO₂ Emissions | |||
|---|---|---|---|
| assigned to | total | average | ratio |
| persons 🙎♀️ | 4791 tonnes CO₂ | 295 g·CO₂/pax/n.mile | 8 % ⚙️ |
| freight 🚛 | 51810 tonnes CO₂ | 721 kg·CO₂/m tonne/n.mile | 92 % ⚙️ |
| total | 56601 tonnes CO₂ | 723 kg·CO₂/n.mile | 100% |
| 2022 yearly statistics | |
|---|---|
| distance travelled | 144921 km ⚙️ |
| time at sea | 4677 hours |
| 2022 average statistics per journey | |
|---|---|
| average persons transported 🙎♀️ | 208 persons ⚙️ |
| average freight transported 🚛 | 919 metric tons ⚙️ |
| average speed | 31 km/h ⚙️ |
2022 monitoring methods:
N/A
2022 Theoretical
EIV (Efficiency Indicator Values): 25.13 gCO₂/ton/nautical mile
﹖ details
| 2021 yearly CO₂ Emissions | |||
|---|---|---|---|
| assigned to | total | average | ratio |
| persons 🙎♀️ | 1030 tonnes CO₂ | 362 g·CO₂/pax/n.mile | 2 % ⚙️ |
| freight 🚛 | 51663 tonnes CO₂ | 455 kg·CO₂/m tonne/n.mile | 98 % ⚙️ |
| total | 52693 tonnes CO₂ | 704 kg·CO₂/n.mile | 100% |
| 2021 yearly statistics | |
|---|---|
| distance travelled | 138660 km ⚙️ |
| time at sea | 4175 hours |
| 2021 average statistics per journey | |
|---|---|
| average persons transported 🙎♀️ | 38 persons ⚙️ |
| average freight transported 🚛 | 1517 metric tons ⚙️ |
| average speed | 33 km/h ⚙️ |
2021 monitoring methods:
N/A
2021 Theoretical
EIV (Efficiency Indicator Values): 25.13 gCO₂/ton/nautical mile
﹖ details
| 2020 yearly CO₂ Emissions | |||
|---|---|---|---|
| assigned to | total | average | ratio |
| persons 🙎♀️ | 42389 tonnes CO₂ | 14656 g·CO₂/pax/n.mile | 100 % ⚙️ |
| freight 🚛 | 42389 tonnes CO₂ | 458 kg·CO₂/m tonne/n.mile | N/A |
| total | 42389 tonnes CO₂ | 673 kg·CO₂/n.mile | 100% |
| 2020 yearly statistics | |
|---|---|
| distance travelled | 116597 km ⚙️ |
| time at sea | 3487 hours |
| 2020 average statistics per journey | |
|---|---|
| average persons transported 🙎♀️ | 46 persons ⚙️ |
| average freight transported 🚛 | 1470 metric tons ⚙️ |
| average speed | 33 km/h ⚙️ |
2020 monitoring methods:
N/A
2020 Theoretical
EIV (Efficiency Indicator Values): 25.13 gCO₂/ton/nautical mile
﹖ details
| 2019 yearly CO₂ Emissions | |||
|---|---|---|---|
| assigned to | total | average | ratio |
| persons 🙎♀️ | 40471 tonnes CO₂ | 7202 g·CO₂/pax/n.mile | 100 % ⚙️ |
| freight 🚛 | 40471 tonnes CO₂ | 1359 kg·CO₂/m tonne/n.mile | N/A |
| total | 40471 tonnes CO₂ | 596 kg·CO₂/n.mile | 100% |
| 2019 yearly statistics | |
|---|---|
| distance travelled | 125671 km ⚙️ |
| time at sea | 4487 hours |
| 2019 average statistics per journey | |
|---|---|
| average persons transported 🙎♀️ | 83 persons ⚙️ |
| average freight transported 🚛 | 439 metric tons ⚙️ |
| average speed | 28 km/h ⚙️ |
2019 monitoring methods:
N/A
2019 Theoretical
N/A
﹖ details
| 2018 yearly CO₂ Emissions | |||
|---|---|---|---|
| assigned to | total | average | ratio |
| persons 🙎♀️ | 45746 tonnes CO₂ | 2 g·CO₂/pax/n.mile | 100 % ⚙️ |
| freight 🚛 | 45746 tonnes CO₂ | 7 kg·CO₂/m tonne/n.mile | N/A |
| total | 45746 tonnes CO₂ | 614 kg·CO₂/n.mile | 100% |
| 2018 yearly statistics | |
|---|---|
| distance travelled | 138086 km ⚙️ |
| time at sea | 5029 hours |
| 2018 average statistics per journey | |
|---|---|
| average persons transported 🙎♀️ | 270282 persons ⚙️ |
| average freight transported 🚛 | 87275 metric tons ⚙️ |
| average speed | 27 km/h ⚙️ |
2018 monitoring methods:
N/A
2018 Theoretical
N/A
﹖ details
ℹ️
Figures with the icon ⚙️ were computed based on the published data.
You can find computation details on
this page ↗
GreenFerries is a hobby project, all the data shown here has no official value. It is Open Source, so you can double check and modify it.

The Ecoscore compares
average CO₂ emissions per passenger per km.
‟emits like 2.1 planes” means that the ferry emits more than twice what an average plane would on the same distance for one passenger.