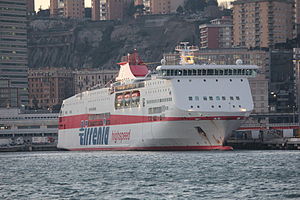
Mykonos Palace

2 to 4 times an average plane's emissions
(based on 2022 data)
Often travels on 1 routes
- Ancona [IT] ↔ Patras [GR] - 912 km
⚠️
Do you know of a route that this ship frequently travels but is not listed? Or have you noticed an error?
Please help by letting us know, thank you 🙇🏽♀️
Please help by letting us know, thank you 🙇🏽♀️
Ship Statistics
| 2022 yearly CO₂ Emissions | |||
|---|---|---|---|
| assigned to | total | average | ratio |
| persons 🙎♀️ | 45611 tonnes CO₂ | 828 g·CO₂/pax/n.mile | 80 % ⚙️ |
| freight 🚛 | 11403 tonnes CO₂ | 49 kg·CO₂/m tonne/n.mile | 20 % ⚙️ |
| total | 57013 tonnes CO₂ | 788 kg·CO₂/n.mile | 100% |
| 2022 yearly statistics | |
|---|---|
| distance travelled | 133948 km ⚙️ |
| time at sea | 3719 hours |
| 2022 average statistics per journey | |
|---|---|
| average persons transported 🙎♀️ | 761 persons ⚙️ |
| average freight transported 🚛 | 3233 metric tons ⚙️ |
| average speed | 36 km/h ⚙️ |
2022 monitoring methods:
N/A
2022 Theoretical
EIV (Efficiency Indicator Values): 20.09 gCO₂/ton/nautical mile
﹖ details
| 2021 yearly CO₂ Emissions | |||
|---|---|---|---|
| assigned to | total | average | ratio |
| persons 🙎♀️ | 41049 tonnes CO₂ | 1063 g·CO₂/pax/n.mile | 80 % ⚙️ |
| freight 🚛 | 10262 tonnes CO₂ | 49 kg·CO₂/m tonne/n.mile | 20 % ⚙️ |
| total | 51311 tonnes CO₂ | 816 kg·CO₂/n.mile | 100% |
| 2021 yearly statistics | |
|---|---|
| distance travelled | 116397 km ⚙️ |
| time at sea | 2953 hours |
| 2021 average statistics per journey | |
|---|---|
| average persons transported 🙎♀️ | 615 persons ⚙️ |
| average freight transported 🚛 | 3354 metric tons ⚙️ |
| average speed | 39 km/h ⚙️ |
2021 monitoring methods:
N/A
2021 Theoretical
EIV (Efficiency Indicator Values): 20.09 gCO₂/ton/nautical mile
﹖ details
| 2020 yearly CO₂ Emissions | |||
|---|---|---|---|
| assigned to | total | average | ratio |
| persons 🙎♀️ | 53768 tonnes CO₂ | 1804 g·CO₂/pax/n.mile | 80 % ⚙️ |
| freight 🚛 | 13442 tonnes CO₂ | 78 kg·CO₂/m tonne/n.mile | 20 % ⚙️ |
| total | 67210 tonnes CO₂ | 850 kg·CO₂/n.mile | 100% |
| 2020 yearly statistics | |
|---|---|
| distance travelled | 146374 km ⚙️ |
| time at sea | 3615 hours |
| 2020 average statistics per journey | |
|---|---|
| average persons transported 🙎♀️ | 377 persons ⚙️ |
| average freight transported 🚛 | 2175 metric tons ⚙️ |
| average speed | 40 km/h ⚙️ |
2020 monitoring methods:
N/A
2020 Theoretical
EIV (Efficiency Indicator Values): 20.09 gCO₂/ton/nautical mile
﹖ details
| 2019 yearly CO₂ Emissions | |||
|---|---|---|---|
| assigned to | total | average | ratio |
| persons 🙎♀️ | 3070 tonnes CO₂ | 55 g·CO₂/pax/n.mile | 4 % ⚙️ |
| freight 🚛 | 78136 tonnes CO₂ | 444 kg·CO₂/m tonne/n.mile | 96 % ⚙️ |
| total | 81206 tonnes CO₂ | 839 kg·CO₂/n.mile | 100% |
| 2019 yearly statistics | |
|---|---|
| distance travelled | 179360 km ⚙️ |
| time at sea | 4155 hours |
| 2019 average statistics per journey | |
|---|---|
| average persons transported 🙎♀️ | 572 persons ⚙️ |
| average freight transported 🚛 | 1816 metric tons ⚙️ |
| average speed | 43 km/h ⚙️ |
2019 monitoring methods:
N/A
2019 Theoretical
EIV (Efficiency Indicator Values): 20.09 gCO₂/ton/nautical mile
﹖ details
| 2018 yearly CO₂ Emissions | |||
|---|---|---|---|
| assigned to | total | average | ratio |
| persons 🙎♀️ | 3466 tonnes CO₂ | 89 g·CO₂/pax/n.mile | 5 % ⚙️ |
| freight 🚛 | 69826 tonnes CO₂ | 891 kg·CO₂/m tonne/n.mile | 95 % ⚙️ |
| total | 73293 tonnes CO₂ | 1260 kg·CO₂/n.mile | 100% |
| 2018 yearly statistics | |
|---|---|
| distance travelled | 107735 km ⚙️ |
| time at sea | 3671 hours |
| 2018 average statistics per journey | |
|---|---|
| average persons transported 🙎♀️ | 671 persons ⚙️ |
| average freight transported 🚛 | 1347 metric tons ⚙️ |
| average speed | 29 km/h ⚙️ |
2018 monitoring methods:
N/A
2018 Theoretical
EIV (Efficiency Indicator Values): 20.09 gCO₂/ton/nautical mile
﹖ details
ℹ️
Figures with the icon ⚙️ were computed based on the published data.
You can find computation details on
this page ↗
GreenFerries is a hobby project, all the data shown here has no official value. It is Open Source, so you can double check and modify it.

The Ecoscore compares
average CO₂ emissions per passenger per km.
‟emits like 2.1 planes” means that the ferry emits more than twice what an average plane would on the same distance for one passenger.