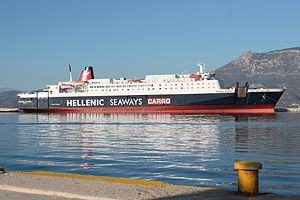
Nissos Rodos

better than riding a car with a single passenger
(based on 2022 data)
Often travels on 2 routes
- Chios [GR] ↔ Oinousses [GR] - 17 km
- Chios [GR] ↔ Psara [GR] - 53 km
⚠️
Do you know of a route that this ship frequently travels but is not listed? Or have you noticed an error?
Please help by letting us know, thank you 🙇🏽♀️
Please help by letting us know, thank you 🙇🏽♀️
Ship Statistics
| 2022 yearly CO₂ Emissions | |||
|---|---|---|---|
| assigned to | total | average | ratio |
| persons 🙎♀️ | 7827 tonnes CO₂ | 224 g·CO₂/pax/n.mile | 25 % ⚙️ |
| freight 🚛 | 23718 tonnes CO₂ | 224 kg·CO₂/m tonne/n.mile | 75 % ⚙️ |
| total | 31545 tonnes CO₂ | 532 kg·CO₂/n.mile | 100% |
| 2022 yearly statistics | |
|---|---|
| distance travelled | 109812 km ⚙️ |
| time at sea | 3179 hours |
| 2022 average statistics per journey | |
|---|---|
| average persons transported 🙎♀️ | 590 persons ⚙️ |
| average freight transported 🚛 | 1786 metric tons ⚙️ |
| average speed | 35 km/h ⚙️ |
2022 monitoring methods:
N/A
2022 Theoretical
EIV (Efficiency Indicator Values): 29.78 gCO₂/ton/nautical mile
﹖ details
| 2021 yearly CO₂ Emissions | |||
|---|---|---|---|
| assigned to | total | average | ratio |
| persons 🙎♀️ | 6124 tonnes CO₂ | 198 g·CO₂/pax/n.mile | 21 % ⚙️ |
| freight 🚛 | 23196 tonnes CO₂ | 207 kg·CO₂/m tonne/n.mile | 79 % ⚙️ |
| total | 29320 tonnes CO₂ | 516 kg·CO₂/n.mile | 100% |
| 2021 yearly statistics | |
|---|---|
| distance travelled | 105268 km ⚙️ |
| time at sea | 3030 hours |
| 2021 average statistics per journey | |
|---|---|
| average persons transported 🙎♀️ | 545 persons ⚙️ |
| average freight transported 🚛 | 1969 metric tons ⚙️ |
| average speed | 35 km/h ⚙️ |
2021 monitoring methods:
N/A
2021 Theoretical
EIV (Efficiency Indicator Values): 29.78 gCO₂/ton/nautical mile
﹖ details
| 2020 yearly CO₂ Emissions | |||
|---|---|---|---|
| assigned to | total | average | ratio |
| persons 🙎♀️ | 4323 tonnes CO₂ | 171 g·CO₂/pax/n.mile | 16 % ⚙️ |
| freight 🚛 | 23446 tonnes CO₂ | 221 kg·CO₂/m tonne/n.mile | 84 % ⚙️ |
| total | 27769 tonnes CO₂ | 513 kg·CO₂/n.mile | 100% |
| 2020 yearly statistics | |
|---|---|
| distance travelled | 100222 km ⚙️ |
| time at sea | 3186 hours |
| 2020 average statistics per journey | |
|---|---|
| average persons transported 🙎♀️ | 466 persons ⚙️ |
| average freight transported 🚛 | 1961 metric tons ⚙️ |
| average speed | 31 km/h ⚙️ |
2020 monitoring methods:
N/A
2020 Theoretical
EIV (Efficiency Indicator Values): 29.78 gCO₂/ton/nautical mile
﹖ details
| 2019 yearly CO₂ Emissions | |||
|---|---|---|---|
| assigned to | total | average | ratio |
| persons 🙎♀️ | 10991 tonnes CO₂ | 232 g·CO₂/pax/n.mile | 28 % ⚙️ |
| freight 🚛 | 28053 tonnes CO₂ | 247 kg·CO₂/m tonne/n.mile | 72 % ⚙️ |
| total | 39044 tonnes CO₂ | 514 kg·CO₂/n.mile | 100% |
| 2019 yearly statistics | |
|---|---|
| distance travelled | 140755 km ⚙️ |
| time at sea | 4023 hours |
| 2019 average statistics per journey | |
|---|---|
| average persons transported 🙎♀️ | 624 persons ⚙️ |
| average freight transported 🚛 | 1494 metric tons ⚙️ |
| average speed | 35 km/h ⚙️ |
2019 monitoring methods:
N/A
2019 Theoretical
EIV (Efficiency Indicator Values): 29.78 gCO₂/ton/nautical mile
﹖ details
| 2018 yearly CO₂ Emissions | |||
|---|---|---|---|
| assigned to | total | average | ratio |
| persons 🙎♀️ | 7312 tonnes CO₂ | 213 g·CO₂/pax/n.mile | 26 % ⚙️ |
| freight 🚛 | 20781 tonnes CO₂ | 532 kg·CO₂/m tonne/n.mile | 74 % ⚙️ |
| total | 28093 tonnes CO₂ | 587 kg·CO₂/n.mile | 100% |
| 2018 yearly statistics | |
|---|---|
| distance travelled | 88582 km ⚙️ |
| time at sea | 2375 hours |
| 2018 average statistics per journey | |
|---|---|
| average persons transported 🙎♀️ | 717 persons ⚙️ |
| average freight transported 🚛 | 816 metric tons ⚙️ |
| average speed | 37 km/h ⚙️ |
2018 monitoring methods:
N/A
2018 Theoretical
EIV (Efficiency Indicator Values): 29.78 gCO₂/ton/nautical mile
﹖ details
ℹ️
Figures with the icon ⚙️ were computed based on the published data.
You can find computation details on
this page ↗
GreenFerries is a hobby project, all the data shown here has no official value. It is Open Source, so you can double check and modify it.

The Ecoscore compares
average CO₂ emissions per passenger per km.
‟emits like 2.1 planes” means that the ferry emits more than twice what an average plane would on the same distance for one passenger.