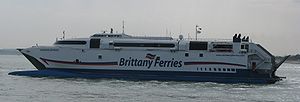
Normandie Express

over 4 times an average plane's emissions
(based on 2022 data)
Often travels on 2 routes
- Caen-Ouistreham [FR] ↔ Portsmouth [GB] - 179 km
- Cherbourg [FR] ↔ Portsmouth [GB] - 134 km
⚠️
Do you know of a route that this ship frequently travels but is not listed? Or have you noticed an error?
Please help by letting us know, thank you 🙇🏽♀️
Please help by letting us know, thank you 🙇🏽♀️
Ship Statistics
| 2022 yearly CO₂ Emissions | |||
|---|---|---|---|
| assigned to | total | average | ratio |
| persons 🙎♀️ | 9081 tonnes CO₂ | 1145 g·CO₂/pax/n.mile | 95 % ⚙️ |
| freight 🚛 | 478 tonnes CO₂ | 127 kg·CO₂/m tonne/n.mile | 5 % ⚙️ |
| total | 9559 tonnes CO₂ | 405 kg·CO₂/n.mile | 100% |
| 2022 yearly statistics | |
|---|---|
| distance travelled | 43762 km ⚙️ |
| time at sea | 917 hours |
| 2022 average statistics per journey | |
|---|---|
| average persons transported 🙎♀️ | 336 persons ⚙️ |
| average freight transported 🚛 | 160 metric tons ⚙️ |
| average speed | 48 km/h ⚙️ |
2022 monitoring methods:
N/A
2022 Theoretical
EIV (Efficiency Indicator Values): 19.8 gCO₂/ton/nautical mile
﹖ details
| 2021 yearly CO₂ Emissions | |||
|---|---|---|---|
| assigned to | total | average | ratio |
| persons 🙎♀️ | 3782 tonnes CO₂ | 2098 g·CO₂/pax/n.mile | 95 % ⚙️ |
| freight 🚛 | 199 tonnes CO₂ | 209 kg·CO₂/m tonne/n.mile | 5 % ⚙️ |
| total | 3981 tonnes CO₂ | 416 kg·CO₂/n.mile | 100% |
| 2021 yearly statistics | |
|---|---|
| distance travelled | 17714 km ⚙️ |
| time at sea | 519 hours |
| 2021 average statistics per journey | |
|---|---|
| average persons transported 🙎♀️ | 189 persons ⚙️ |
| average freight transported 🚛 | 100 metric tons ⚙️ |
| average speed | 34 km/h ⚙️ |
2021 monitoring methods:
N/A
2021 Theoretical
EIV (Efficiency Indicator Values): 19.8 gCO₂/ton/nautical mile
﹖ details
| 2020 yearly CO₂ Emissions | |||
|---|---|---|---|
| assigned to | total | average | ratio |
| persons 🙎♀️ | N/A | N/A | N/A |
| freight 🚛 | N/A | N/A | 100 % ⚙️ |
| total | N/A | N/A | 100% |
| 2020 yearly statistics | |
|---|---|
| distance travelled | N/A |
| time at sea | N/A |
| 2020 average statistics per journey | |
|---|---|
| average persons transported 🙎♀️ | N/A |
| average freight transported 🚛 | N/A |
| average speed | N/A |
2020 monitoring methods:
N/A
2020 Theoretical
EIV (Efficiency Indicator Values): 11.26 gCO₂/ton/nautical mile
﹖ details
| 2019 yearly CO₂ Emissions | |||
|---|---|---|---|
| assigned to | total | average | ratio |
| persons 🙎♀️ | 10459 tonnes CO₂ | 917 g·CO₂/pax/n.mile | 100 % ⚙️ |
| freight 🚛 | N/A | N/A | N/A |
| total | 10459 tonnes CO₂ | 442 kg·CO₂/n.mile | 100% |
| 2019 yearly statistics | |
|---|---|
| distance travelled | 43834 km ⚙️ |
| time at sea | 932 hours |
| 2019 average statistics per journey | |
|---|---|
| average persons transported 🙎♀️ | 482 persons ⚙️ |
| average freight transported 🚛 | N/A |
| average speed | 47 km/h ⚙️ |
2019 monitoring methods:
N/A
2019 Theoretical
EIV (Efficiency Indicator Values): 11.26 gCO₂/ton/nautical mile
﹖ details
| 2018 yearly CO₂ Emissions | |||
|---|---|---|---|
| assigned to | total | average | ratio |
| persons 🙎♀️ | 11013 tonnes CO₂ | 847 g·CO₂/pax/n.mile | 100 % ⚙️ |
| freight 🚛 | N/A | N/A | N/A |
| total | 11013 tonnes CO₂ | 449 kg·CO₂/n.mile | 100% |
| 2018 yearly statistics | |
|---|---|
| distance travelled | 45374 km ⚙️ |
| time at sea | 1109 hours |
| 2018 average statistics per journey | |
|---|---|
| average persons transported 🙎♀️ | 531 persons ⚙️ |
| average freight transported 🚛 | N/A |
| average speed | 41 km/h ⚙️ |
2018 monitoring methods:
N/A
2018 Theoretical
EIV (Efficiency Indicator Values): 11.26 gCO₂/ton/nautical mile
﹖ details
ℹ️
Figures with the icon ⚙️ were computed based on the published data.
You can find computation details on
this page ↗
GreenFerries is a hobby project, all the data shown here has no official value. It is Open Source, so you can double check and modify it.

The Ecoscore compares
average CO₂ emissions per passenger per km.
‟emits like 2.1 planes” means that the ferry emits more than twice what an average plane would on the same distance for one passenger.