Olympic Champion

better than riding a car with two passengers
(based on 2022 data)
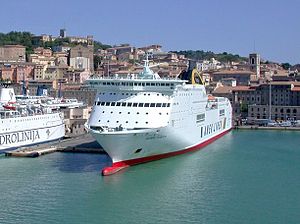
Often travels on 3 routes
- Ancona [IT] ↔ Igoumenitsa [GR] - 723 km
- Ancona [IT] ↔ Patras [GR] - 912 km
- Patras [GR] ↔ Igoumenitsa [GR] - 189 km
⚠️
Do you know of a route that this ship frequently travels but is not listed? Or have you noticed an error?
Please help by letting us know, thank you 🙇🏽♀️
Please help by letting us know, thank you 🙇🏽♀️
Ship Statistics
| 2022 yearly CO₂ Emissions | |||
|---|---|---|---|
| assigned to | total | average | ratio |
| persons 🙎♀️ | 1355 tonnes CO₂ | 14 g·CO₂/pax/n.mile | 1 % ⚙️ |
| freight 🚛 | 94366 tonnes CO₂ | 213 kg·CO₂/m tonne/n.mile | 99 % ⚙️ |
| total | 98108 tonnes CO₂ | 794 kg·CO₂/n.mile | 100% |
| 2022 yearly statistics | |
|---|---|
| distance travelled | 228727 km ⚙️ |
| time at sea | 5745 hours |
| 2022 average statistics per journey | |
|---|---|
| average persons transported 🙎♀️ | 773 persons ⚙️ |
| average freight transported 🚛 | 3591 metric tons ⚙️ |
| average speed | 40 km/h ⚙️ |
2022 monitoring methods:
N/A
2022 Theoretical
EIV (Efficiency Indicator Values): 20.55 gCO₂/ton/nautical mile
﹖ details
| 2021 yearly CO₂ Emissions | |||
|---|---|---|---|
| assigned to | total | average | ratio |
| persons 🙎♀️ | 952 tonnes CO₂ | 16 g·CO₂/pax/n.mile | 0.880645738450777 % ⚙️ |
| freight 🚛 | 107197 tonnes CO₂ | 243 kg·CO₂/m tonne/n.mile | 99 % ⚙️ |
| total | 108149 tonnes CO₂ | 807 kg·CO₂/n.mile | 100% |
| 2021 yearly statistics | |
|---|---|
| distance travelled | 248058 km ⚙️ |
| time at sea | 6151 hours |
| 2021 average statistics per journey | |
|---|---|
| average persons transported 🙎♀️ | 438 persons ⚙️ |
| average freight transported 🚛 | 3294 metric tons ⚙️ |
| average speed | 40 km/h ⚙️ |
2021 monitoring methods:
N/A
2021 Theoretical
EIV (Efficiency Indicator Values): 20.55 gCO₂/ton/nautical mile
﹖ details
| 2020 yearly CO₂ Emissions | |||
|---|---|---|---|
| assigned to | total | average | ratio |
| persons 🙎♀️ | 546 tonnes CO₂ | 18 g·CO₂/pax/n.mile | 0.5388681743743162 % ⚙️ |
| freight 🚛 | 100709 tonnes CO₂ | 239 kg·CO₂/m tonne/n.mile | 99 % ⚙️ |
| total | 101255 tonnes CO₂ | 763 kg·CO₂/n.mile | 100% |
| 2020 yearly statistics | |
|---|---|
| distance travelled | 245885 km ⚙️ |
| time at sea | 5853 hours |
| 2020 average statistics per journey | |
|---|---|
| average persons transported 🙎♀️ | 234 persons ⚙️ |
| average freight transported 🚛 | 3168 metric tons ⚙️ |
| average speed | 42 km/h ⚙️ |
2020 monitoring methods:
N/A
2020 Theoretical
EIV (Efficiency Indicator Values): 20.55 gCO₂/ton/nautical mile
﹖ details
| 2019 yearly CO₂ Emissions | |||
|---|---|---|---|
| assigned to | total | average | ratio |
| persons 🙎♀️ | 1135 tonnes CO₂ | 17 g·CO₂/pax/n.mile | 1 % ⚙️ |
| freight 🚛 | 95675 tonnes CO₂ | 223 kg·CO₂/m tonne/n.mile | 99 % ⚙️ |
| total | 96810 tonnes CO₂ | 820 kg·CO₂/n.mile | 100% |
| 2019 yearly statistics | |
|---|---|
| distance travelled | 218783 km ⚙️ |
| time at sea | 5383 hours |
| 2019 average statistics per journey | |
|---|---|
| average persons transported 🙎♀️ | 569 persons ⚙️ |
| average freight transported 🚛 | 3639 metric tons ⚙️ |
| average speed | 41 km/h ⚙️ |
2019 monitoring methods:
N/A
2019 Theoretical
EIV (Efficiency Indicator Values): 20.55 gCO₂/ton/nautical mile
﹖ details
| 2018 yearly CO₂ Emissions | |||
|---|---|---|---|
| assigned to | total | average | ratio |
| persons 🙎♀️ | 1303 tonnes CO₂ | 18 g·CO₂/pax/n.mile | 1 % ⚙️ |
| freight 🚛 | 104899 tonnes CO₂ | 229 kg·CO₂/m tonne/n.mile | 99 % ⚙️ |
| total | 106203 tonnes CO₂ | 846 kg·CO₂/n.mile | 100% |
| 2018 yearly statistics | |
|---|---|
| distance travelled | 232571 km ⚙️ |
| time at sea | 5516 hours |
| 2018 average statistics per journey | |
|---|---|
| average persons transported 🙎♀️ | 571 persons ⚙️ |
| average freight transported 🚛 | 3654 metric tons ⚙️ |
| average speed | 42 km/h ⚙️ |
2018 monitoring methods:
N/A
2018 Theoretical
EIV (Efficiency Indicator Values): 20.55 gCO₂/ton/nautical mile
﹖ details
ℹ️
Figures with the icon ⚙️ were computed based on the published data.
You can find computation details on
this page ↗
GreenFerries is a hobby project, all the data shown here has no official value. It is Open Source, so you can double check and modify it.

The Ecoscore compares
average CO₂ emissions per passenger per km.
‟emits like 2.1 planes” means that the ferry emits more than twice what an average plane would on the same distance for one passenger.