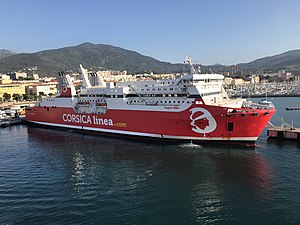
Paglia Orba

1 to 2 times an average plane's emissions
(based on 2022 data)
Often travels on 1 routes
- Marseille [FR] ↔ Ajaccio [FR] - 316 km
⚠️
Do you know of a route that this ship frequently travels but is not listed? Or have you noticed an error?
Please help by letting us know, thank you 🙇🏽♀️
Please help by letting us know, thank you 🙇🏽♀️
Ship Statistics
| 2022 yearly CO₂ Emissions | |||
|---|---|---|---|
| assigned to | total | average | ratio |
| persons 🙎♀️ | 8381 tonnes CO₂ | 391 g·CO₂/pax/n.mile | 21 % ⚙️ |
| freight 🚛 | 28753 tonnes CO₂ | 436 kg·CO₂/m tonne/n.mile | 79 % ⚙️ |
| total | 40629 tonnes CO₂ | 555 kg·CO₂/n.mile | 100% |
| 2022 yearly statistics | |
|---|---|
| distance travelled | 135509 km ⚙️ |
| time at sea | 4303 hours |
| 2022 average statistics per journey | |
|---|---|
| average persons transported 🙎♀️ | 293 persons ⚙️ |
| average freight transported 🚛 | 902 metric tons ⚙️ |
| average speed | 31 km/h ⚙️ |
2022 monitoring methods:
N/A
2022 Theoretical
EIV (Efficiency Indicator Values): 29.69 gCO₂/ton/nautical mile
﹖ details
| 2021 yearly CO₂ Emissions | |||
|---|---|---|---|
| assigned to | total | average | ratio |
| persons 🙎♀️ | 9899 tonnes CO₂ | 815 g·CO₂/pax/n.mile | 39 % ⚙️ |
| freight 🚛 | 11866 tonnes CO₂ | 433 kg·CO₂/m tonne/n.mile | 61 % ⚙️ |
| total | 25084 tonnes CO₂ | 517 kg·CO₂/n.mile | 100% |
| 2021 yearly statistics | |
|---|---|
| distance travelled | 89783 km ⚙️ |
| time at sea | 3003 hours |
| 2021 average statistics per journey | |
|---|---|
| average persons transported 🙎♀️ | 250 persons ⚙️ |
| average freight transported 🚛 | 565 metric tons ⚙️ |
| average speed | 30 km/h ⚙️ |
2021 monitoring methods:
N/A
2021 Theoretical
EIV (Efficiency Indicator Values): 29.69 gCO₂/ton/nautical mile
﹖ details
| 2020 yearly CO₂ Emissions | |||
|---|---|---|---|
| assigned to | total | average | ratio |
| persons 🙎♀️ | 4076 tonnes CO₂ | 330 g·CO₂/pax/n.mile | 13 % ⚙️ |
| freight 🚛 | 23887 tonnes CO₂ | 305 kg·CO₂/m tonne/n.mile | 87 % ⚙️ |
| total | 31495 tonnes CO₂ | 578 kg·CO₂/n.mile | 100% |
| 2020 yearly statistics | |
|---|---|
| distance travelled | 100963 km ⚙️ |
| time at sea | 3139 hours |
| 2020 average statistics per journey | |
|---|---|
| average persons transported 🙎♀️ | 226 persons ⚙️ |
| average freight transported 🚛 | 1436 metric tons ⚙️ |
| average speed | 32 km/h ⚙️ |
2020 monitoring methods:
N/A
2020 Theoretical
EIV (Efficiency Indicator Values): 8.09 gCO₂/ton/nautical mile
﹖ details
| 2019 yearly CO₂ Emissions | |||
|---|---|---|---|
| assigned to | total | average | ratio |
| persons 🙎♀️ | 7096 tonnes CO₂ | 356 g·CO₂/pax/n.mile | 19 % ⚙️ |
| freight 🚛 | 25863 tonnes CO₂ | 284 kg·CO₂/m tonne/n.mile | 81 % ⚙️ |
| total | 36934 tonnes CO₂ | 537 kg·CO₂/n.mile | 100% |
| 2019 yearly statistics | |
|---|---|
| distance travelled | 127374 km ⚙️ |
| time at sea | 4056 hours |
| 2019 average statistics per journey | |
|---|---|
| average persons transported 🙎♀️ | 290 persons ⚙️ |
| average freight transported 🚛 | 1325 metric tons ⚙️ |
| average speed | 31 km/h ⚙️ |
2019 monitoring methods:
N/A
2019 Theoretical
EIV (Efficiency Indicator Values): 8.09 gCO₂/ton/nautical mile
﹖ details
| 2018 yearly CO₂ Emissions | |||
|---|---|---|---|
| assigned to | total | average | ratio |
| persons 🙎♀️ | 6305 tonnes CO₂ | 316 g·CO₂/pax/n.mile | 15 % ⚙️ |
| freight 🚛 | 30604 tonnes CO₂ | 368 kg·CO₂/m tonne/n.mile | 85 % ⚙️ |
| total | 41067 tonnes CO₂ | 532 kg·CO₂/n.mile | 100% |
| 2018 yearly statistics | |
|---|---|
| distance travelled | 143031 km ⚙️ |
| time at sea | 4556 hours |
| 2018 average statistics per journey | |
|---|---|
| average persons transported 🙎♀️ | 258 persons ⚙️ |
| average freight transported 🚛 | 1077 metric tons ⚙️ |
| average speed | 31 km/h ⚙️ |
2018 monitoring methods:
N/A
2018 Theoretical
EIV (Efficiency Indicator Values): 8.09 gCO₂/ton/nautical mile
﹖ details
ℹ️
Figures with the icon ⚙️ were computed based on the published data.
You can find computation details on
this page ↗
GreenFerries is a hobby project, all the data shown here has no official value. It is Open Source, so you can double check and modify it.

The Ecoscore compares
average CO₂ emissions per passenger per km.
‟emits like 2.1 planes” means that the ferry emits more than twice what an average plane would on the same distance for one passenger.