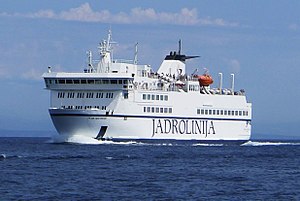
Petar Hektorović

better than riding a car with two passengers
(based on 2022 data)
Often travels on 1 routes
- Split [HR] ↔ Vis [HR] - 53 km
⚠️
Do you know of a route that this ship frequently travels but is not listed? Or have you noticed an error?
Please help by letting us know, thank you 🙇🏽♀️
Please help by letting us know, thank you 🙇🏽♀️
Ship Statistics
| 2022 yearly CO₂ Emissions | |||
|---|---|---|---|
| assigned to | total | average | ratio |
| persons 🙎♀️ | 462 tonnes CO₂ | 0.04 g·CO₂/pax/n.mile | 8 % ⚙️ |
| freight 🚛 | 5033 tonnes CO₂ | 0.42 kg·CO₂/m tonne/n.mile | 92 % ⚙️ |
| total | 5495 tonnes CO₂ | 128 kg·CO₂/n.mile | 100% |
| 2022 yearly statistics | |
|---|---|
| distance travelled | 79618 km ⚙️ |
| time at sea | 3361 hours |
| 2022 average statistics per journey | |
|---|---|
| average persons transported 🙎♀️ | 268660 persons ⚙️ |
| average freight transported 🚛 | 278770 metric tons ⚙️ |
| average speed | 24 km/h ⚙️ |
2022 monitoring methods:
N/A
2022 Theoretical
EIV (Efficiency Indicator Values): 11.5 gCO₂/ton/nautical mile
﹖ details
| 2021 yearly CO₂ Emissions | |||
|---|---|---|---|
| assigned to | total | average | ratio |
| persons 🙎♀️ | 4389 tonnes CO₂ | 0.44 g·CO₂/pax/n.mile | 80 % ⚙️ |
| freight 🚛 | 4389 tonnes CO₂ | 0.42 kg·CO₂/m tonne/n.mile | 20 % ⚙️ |
| total | 5486 tonnes CO₂ | 128 kg·CO₂/n.mile | 100% |
| 2021 yearly statistics | |
|---|---|
| distance travelled | 79487 km ⚙️ |
| time at sea | 3283 hours |
| 2021 average statistics per journey | |
|---|---|
| average persons transported 🙎♀️ | 232400 persons ⚙️ |
| average freight transported 🚛 | 243467 metric tons ⚙️ |
| average speed | 24 km/h ⚙️ |
2021 monitoring methods:
N/A
2021 Theoretical
EIV (Efficiency Indicator Values): 11.5 gCO₂/ton/nautical mile
﹖ details
| 2020 yearly CO₂ Emissions | |||
|---|---|---|---|
| assigned to | total | average | ratio |
| persons 🙎♀️ | 4350 tonnes CO₂ | 0.66 g·CO₂/pax/n.mile | 80 % ⚙️ |
| freight 🚛 | 4350 tonnes CO₂ | 0.56 kg·CO₂/m tonne/n.mile | 20 % ⚙️ |
| total | 5437 tonnes CO₂ | 135 kg·CO₂/n.mile | 100% |
| 2020 yearly statistics | |
|---|---|
| distance travelled | 74798 km ⚙️ |
| time at sea | 3215 hours |
| 2020 average statistics per journey | |
|---|---|
| average persons transported 🙎♀️ | 163188 persons ⚙️ |
| average freight transported 🚛 | 192328 metric tons ⚙️ |
| average speed | 23 km/h ⚙️ |
2020 monitoring methods:
N/A
2020 Theoretical
EIV (Efficiency Indicator Values): 11.5 gCO₂/ton/nautical mile
﹖ details
| 2019 yearly CO₂ Emissions | |||
|---|---|---|---|
| assigned to | total | average | ratio |
| persons 🙎♀️ | 5414 tonnes CO₂ | 0.53 g·CO₂/pax/n.mile | 100 % ⚙️ |
| freight 🚛 | 5414 tonnes CO₂ | 0.66 kg·CO₂/m tonne/n.mile | N/A |
| total | 5414 tonnes CO₂ | 130 kg·CO₂/n.mile | 100% |
| 2019 yearly statistics | |
|---|---|
| distance travelled | 77019 km ⚙️ |
| time at sea | 3207 hours |
| 2019 average statistics per journey | |
|---|---|
| average persons transported 🙎♀️ | 245623 persons ⚙️ |
| average freight transported 🚛 | 197242 metric tons ⚙️ |
| average speed | 24 km/h ⚙️ |
2019 monitoring methods:
N/A
2019 Theoretical
EIV (Efficiency Indicator Values): 11.5 gCO₂/ton/nautical mile
﹖ details
| 2018 yearly CO₂ Emissions | |||
|---|---|---|---|
| assigned to | total | average | ratio |
| persons 🙎♀️ | 5692 tonnes CO₂ | 0.53 g·CO₂/pax/n.mile | 100 % ⚙️ |
| freight 🚛 | 5692 tonnes CO₂ | 0.75 kg·CO₂/m tonne/n.mile | 0.00017567128389739395 % ⚙️ |
| total | 5692 tonnes CO₂ | 131 kg·CO₂/n.mile | 100% |
| 2018 yearly statistics | |
|---|---|
| distance travelled | 80262 km ⚙️ |
| time at sea | 3357 hours |
| 2018 average statistics per journey | |
|---|---|
| average persons transported 🙎♀️ | 247830 persons ⚙️ |
| average freight transported 🚛 | 175133 metric tons ⚙️ |
| average speed | 24 km/h ⚙️ |
2018 monitoring methods:
N/A
2018 Theoretical
EIV (Efficiency Indicator Values): 11.5 gCO₂/ton/nautical mile
﹖ details
ℹ️
Figures with the icon ⚙️ were computed based on the published data.
You can find computation details on
this page ↗
GreenFerries is a hobby project, all the data shown here has no official value. It is Open Source, so you can double check and modify it.

The Ecoscore compares
average CO₂ emissions per passenger per km.
‟emits like 2.1 planes” means that the ferry emits more than twice what an average plane would on the same distance for one passenger.