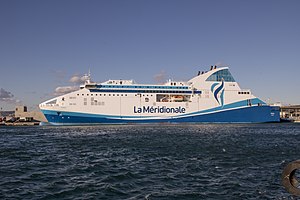
Piana

2 to 4 times an average plane's emissions
(based on 2022 data)
Often travels on 1 routes
- Marseille [FR] ↔ Bastia [FR] - 339 km
⚠️
Do you know of a route that this ship frequently travels but is not listed? Or have you noticed an error?
Please help by letting us know, thank you 🙇🏽♀️
Please help by letting us know, thank you 🙇🏽♀️
Ship Statistics
| 2022 yearly CO₂ Emissions | |||
|---|---|---|---|
| assigned to | total | average | ratio |
| persons 🙎♀️ | 10694 tonnes CO₂ | 575 g·CO₂/pax/n.mile | 26 % ⚙️ |
| freight 🚛 | 30176 tonnes CO₂ | 459 kg·CO₂/m tonne/n.mile | 74 % ⚙️ |
| total | 40870 tonnes CO₂ | 637 kg·CO₂/n.mile | 100% |
| 2022 yearly statistics | |
|---|---|
| distance travelled | 118735 km ⚙️ |
| time at sea | 4332 hours |
| 2022 average statistics per journey | |
|---|---|
| average persons transported 🙎♀️ | 290 persons ⚙️ |
| average freight transported 🚛 | 1024 metric tons ⚙️ |
| average speed | 27 km/h ⚙️ |
2022 monitoring methods:
N/A
2022 Theoretical
EIV (Efficiency Indicator Values): 16.17 gCO₂/ton/nautical mile
﹖ details
| 2021 yearly CO₂ Emissions | |||
|---|---|---|---|
| assigned to | total | average | ratio |
| persons 🙎♀️ | 11971 tonnes CO₂ | 819 g·CO₂/pax/n.mile | 30 % ⚙️ |
| freight 🚛 | 29759 tonnes CO₂ | 547 kg·CO₂/m tonne/n.mile | 70 % ⚙️ |
| total | 40303 tonnes CO₂ | 654 kg·CO₂/n.mile | 100% |
| 2021 yearly statistics | |
|---|---|
| distance travelled | 114204 km ⚙️ |
| time at sea | 3902 hours |
| 2021 average statistics per journey | |
|---|---|
| average persons transported 🙎♀️ | 237 persons ⚙️ |
| average freight transported 🚛 | 882 metric tons ⚙️ |
| average speed | 29 km/h ⚙️ |
2021 monitoring methods:
N/A
2021 Theoretical
EIV (Efficiency Indicator Values): 16.17 gCO₂/ton/nautical mile
﹖ details
| 2020 yearly CO₂ Emissions | |||
|---|---|---|---|
| assigned to | total | average | ratio |
| persons 🙎♀️ | 8245 tonnes CO₂ | 564 g·CO₂/pax/n.mile | 22 % ⚙️ |
| freight 🚛 | 26951 tonnes CO₂ | 624 kg·CO₂/m tonne/n.mile | 78 % ⚙️ |
| total | 37754 tonnes CO₂ | 631 kg·CO₂/n.mile | 100% |
| 2020 yearly statistics | |
|---|---|
| distance travelled | 110785 km ⚙️ |
| time at sea | 3411 hours |
| 2020 average statistics per journey | |
|---|---|
| average persons transported 🙎♀️ | 244 persons ⚙️ |
| average freight transported 🚛 | 722 metric tons ⚙️ |
| average speed | 32 km/h ⚙️ |
2020 monitoring methods:
N/A
2020 Theoretical
EIV (Efficiency Indicator Values): 16.17 gCO₂/ton/nautical mile
﹖ details
| 2019 yearly CO₂ Emissions | |||
|---|---|---|---|
| assigned to | total | average | ratio |
| persons 🙎♀️ | 7726 tonnes CO₂ | 343 g·CO₂/pax/n.mile | 16 % ⚙️ |
| freight 🚛 | 36780 tonnes CO₂ | 435 kg·CO₂/m tonne/n.mile | 84 % ⚙️ |
| total | 47944 tonnes CO₂ | 677 kg·CO₂/n.mile | 100% |
| 2019 yearly statistics | |
|---|---|
| distance travelled | 131184 km ⚙️ |
| time at sea | 3955 hours |
| 2019 average statistics per journey | |
|---|---|
| average persons transported 🙎♀️ | 318 persons ⚙️ |
| average freight transported 🚛 | 1194 metric tons ⚙️ |
| average speed | 33 km/h ⚙️ |
2019 monitoring methods:
N/A
2019 Theoretical
EIV (Efficiency Indicator Values): 11.5 gCO₂/ton/nautical mile
﹖ details
| 2018 yearly CO₂ Emissions | |||
|---|---|---|---|
| assigned to | total | average | ratio |
| persons 🙎♀️ | 5574 tonnes CO₂ | 233 g·CO₂/pax/n.mile | 12 % ⚙️ |
| freight 🚛 | 38895 tonnes CO₂ | 372 kg·CO₂/m tonne/n.mile | 88 % ⚙️ |
| total | 47825 tonnes CO₂ | 664 kg·CO₂/n.mile | 100% |
| 2018 yearly statistics | |
|---|---|
| distance travelled | 133298 km ⚙️ |
| time at sea | 4022 hours |
| 2018 average statistics per journey | |
|---|---|
| average persons transported 🙎♀️ | 333 persons ⚙️ |
| average freight transported 🚛 | 1452 metric tons ⚙️ |
| average speed | 33 km/h ⚙️ |
2018 monitoring methods:
N/A
2018 Theoretical
EIV (Efficiency Indicator Values): 29.36 gCO₂/ton/nautical mile
﹖ details
ℹ️
Figures with the icon ⚙️ were computed based on the published data.
You can find computation details on
this page ↗
GreenFerries is a hobby project, all the data shown here has no official value. It is Open Source, so you can double check and modify it.

The Ecoscore compares
average CO₂ emissions per passenger per km.
‟emits like 2.1 planes” means that the ferry emits more than twice what an average plane would on the same distance for one passenger.