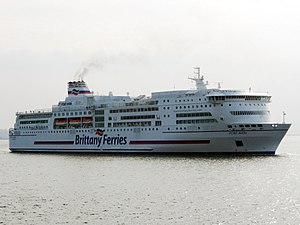
Pont-Aven

over 4 times an average plane's emissions
(based on 2022 data)
Often travels on 1 routes
- Saint-Malo [FR] ↔ Portsmouth [GB] - 250 km
⚠️
Do you know of a route that this ship frequently travels but is not listed? Or have you noticed an error?
Please help by letting us know, thank you 🙇🏽♀️
Please help by letting us know, thank you 🙇🏽♀️
Ship Statistics
| 2022 yearly CO₂ Emissions | |||
|---|---|---|---|
| assigned to | total | average | ratio |
| persons 🙎♀️ | 87424 tonnes CO₂ | 1200 g·CO₂/pax/n.mile | 98 % ⚙️ |
| freight 🚛 | 1512 tonnes CO₂ | 66 kg·CO₂/m tonne/n.mile | 2 % ⚙️ |
| total | 88936 tonnes CO₂ | 933 kg·CO₂/n.mile | 100% |
| 2022 yearly statistics | |
|---|---|
| distance travelled | 176506 km ⚙️ |
| time at sea | 5046 hours |
| 2022 average statistics per journey | |
|---|---|
| average persons transported 🙎♀️ | 765 persons ⚙️ |
| average freight transported 🚛 | 239 metric tons ⚙️ |
| average speed | 35 km/h ⚙️ |
2022 monitoring methods:
N/A
2022 Theoretical
EIV (Efficiency Indicator Values): 24.45 gCO₂/ton/nautical mile
﹖ details
| 2021 yearly CO₂ Emissions | |||
|---|---|---|---|
| assigned to | total | average | ratio |
| persons 🙎♀️ | 34900 tonnes CO₂ | 1390 g·CO₂/pax/n.mile | 63 % ⚙️ |
| freight 🚛 | 20636 tonnes CO₂ | 1380 kg·CO₂/m tonne/n.mile | 37 % ⚙️ |
| total | 55536 tonnes CO₂ | 1004 kg·CO₂/n.mile | 100% |
| 2021 yearly statistics | |
|---|---|
| distance travelled | 102467 km ⚙️ |
| time at sea | 2868 hours |
| 2021 average statistics per journey | |
|---|---|
| average persons transported 🙎♀️ | 454 persons ⚙️ |
| average freight transported 🚛 | 270 metric tons ⚙️ |
| average speed | 36 km/h ⚙️ |
2021 monitoring methods:
N/A
2021 Theoretical
EIV (Efficiency Indicator Values): 24.45 gCO₂/ton/nautical mile
﹖ details
| 2020 yearly CO₂ Emissions | |||
|---|---|---|---|
| assigned to | total | average | ratio |
| persons 🙎♀️ | 19728 tonnes CO₂ | 1415 g·CO₂/pax/n.mile | 42 % ⚙️ |
| freight 🚛 | 27598 tonnes CO₂ | 1333 kg·CO₂/m tonne/n.mile | 58 % ⚙️ |
| total | 47326 tonnes CO₂ | 1079 kg·CO₂/n.mile | 100% |
| 2020 yearly statistics | |
|---|---|
| distance travelled | 81207 km ⚙️ |
| time at sea | 2424 hours |
| 2020 average statistics per journey | |
|---|---|
| average persons transported 🙎♀️ | 318 persons ⚙️ |
| average freight transported 🚛 | 472 metric tons ⚙️ |
| average speed | 34 km/h ⚙️ |
2020 monitoring methods:
N/A
2020 Theoretical
EIV (Efficiency Indicator Values): 24.45 gCO₂/ton/nautical mile
﹖ details
| 2019 yearly CO₂ Emissions | |||
|---|---|---|---|
| assigned to | total | average | ratio |
| persons 🙎♀️ | 40104 tonnes CO₂ | 593 g·CO₂/pax/n.mile | 52 % ⚙️ |
| freight 🚛 | 37582 tonnes CO₂ | 758 kg·CO₂/m tonne/n.mile | 48 % ⚙️ |
| total | 77686 tonnes CO₂ | 881 kg·CO₂/n.mile | 100% |
| 2019 yearly statistics | |
|---|---|
| distance travelled | 163388 km ⚙️ |
| time at sea | 5104 hours |
| 2019 average statistics per journey | |
|---|---|
| average persons transported 🙎♀️ | 767 persons ⚙️ |
| average freight transported 🚛 | 562 metric tons ⚙️ |
| average speed | 32 km/h ⚙️ |
2019 monitoring methods:
N/A
2019 Theoretical
EIV (Efficiency Indicator Values): 24.45 gCO₂/ton/nautical mile
﹖ details
| 2018 yearly CO₂ Emissions | |||
|---|---|---|---|
| assigned to | total | average | ratio |
| persons 🙎♀️ | 58111 tonnes CO₂ | 642 g·CO₂/pax/n.mile | 58 % ⚙️ |
| freight 🚛 | 42435 tonnes CO₂ | 827 kg·CO₂/m tonne/n.mile | 42 % ⚙️ |
| total | 100546 tonnes CO₂ | 972 kg·CO₂/n.mile | 100% |
| 2018 yearly statistics | |
|---|---|
| distance travelled | 191560 km ⚙️ |
| time at sea | 5715 hours |
| 2018 average statistics per journey | |
|---|---|
| average persons transported 🙎♀️ | 875 persons ⚙️ |
| average freight transported 🚛 | 496 metric tons ⚙️ |
| average speed | 34 km/h ⚙️ |
2018 monitoring methods:
N/A
2018 Theoretical
EIV (Efficiency Indicator Values): 24.45 gCO₂/ton/nautical mile
﹖ details
ℹ️
Figures with the icon ⚙️ were computed based on the published data.
You can find computation details on
this page ↗
GreenFerries is a hobby project, all the data shown here has no official value. It is Open Source, so you can double check and modify it.

The Ecoscore compares
average CO₂ emissions per passenger per km.
‟emits like 2.1 planes” means that the ferry emits more than twice what an average plane would on the same distance for one passenger.