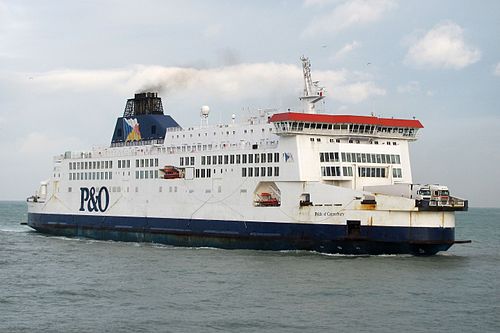
Pride Of Canterbury

1 to 2 times an average plane's emissions
(based on 2022 data)
Often travels on 0 routes
⚠️
Do you know of a route that this ship frequently travels but is not listed? Or have you noticed an error?
Please help by letting us know, thank you 🙇🏽♀️
Please help by letting us know, thank you 🙇🏽♀️
Ship Statistics
| 2022 yearly CO₂ Emissions | |||
|---|---|---|---|
| assigned to | total | average | ratio |
| persons 🙎♀️ | 3717 tonnes CO₂ | 451 g·CO₂/pax/n.mile | 15 % ⚙️ |
| freight 🚛 | 21064 tonnes CO₂ | 386 kg·CO₂/m tonne/n.mile | 85 % ⚙️ |
| total | 24782 tonnes CO₂ | 707 kg·CO₂/n.mile | 100% |
| 2022 yearly statistics | |
|---|---|
| distance travelled | 64928 km ⚙️ |
| time at sea | 2846 hours |
| 2022 average statistics per journey | |
|---|---|
| average persons transported 🙎♀️ | 235 persons ⚙️ |
| average freight transported 🚛 | 1556 metric tons ⚙️ |
| average speed | 23 km/h ⚙️ |
2022 monitoring methods:
N/A
2022 Theoretical
EIV (Efficiency Indicator Values): 24.15 gCO₂/ton/nautical mile
﹖ details
| 2021 yearly CO₂ Emissions | |||
|---|---|---|---|
| assigned to | total | average | ratio |
| persons 🙎♀️ | 6504 tonnes CO₂ | 1211 g·CO₂/pax/n.mile | 15 % ⚙️ |
| freight 🚛 | 36858 tonnes CO₂ | 355 kg·CO₂/m tonne/n.mile | 85 % ⚙️ |
| total | 43363 tonnes CO₂ | 733 kg·CO₂/n.mile | 100% |
| 2021 yearly statistics | |
|---|---|
| distance travelled | 109518 km ⚙️ |
| time at sea | 4581 hours |
| 2021 average statistics per journey | |
|---|---|
| average persons transported 🙎♀️ | 91 persons ⚙️ |
| average freight transported 🚛 | 1755 metric tons ⚙️ |
| average speed | 24 km/h ⚙️ |
2021 monitoring methods:
N/A
2021 Theoretical
EIV (Efficiency Indicator Values): 24.15 gCO₂/ton/nautical mile
﹖ details
| 2020 yearly CO₂ Emissions | |||
|---|---|---|---|
| assigned to | total | average | ratio |
| persons 🙎♀️ | 2896 tonnes CO₂ | 648 g·CO₂/pax/n.mile | 15 % ⚙️ |
| freight 🚛 | 16410 tonnes CO₂ | 322 kg·CO₂/m tonne/n.mile | 85 % ⚙️ |
| total | 19306 tonnes CO₂ | 718 kg·CO₂/n.mile | 100% |
| 2020 yearly statistics | |
|---|---|
| distance travelled | 49813 km ⚙️ |
| time at sea | 1997 hours |
| 2020 average statistics per journey | |
|---|---|
| average persons transported 🙎♀️ | 166 persons ⚙️ |
| average freight transported 🚛 | 1893 metric tons ⚙️ |
| average speed | 25 km/h ⚙️ |
2020 monitoring methods:
N/A
2020 Theoretical
EIV (Efficiency Indicator Values): 24.15 gCO₂/ton/nautical mile
﹖ details
| 2019 yearly CO₂ Emissions | |||
|---|---|---|---|
| assigned to | total | average | ratio |
| persons 🙎♀️ | 7196 tonnes CO₂ | 254 g·CO₂/pax/n.mile | 15 % ⚙️ |
| freight 🚛 | 40775 tonnes CO₂ | 364 kg·CO₂/m tonne/n.mile | 85 % ⚙️ |
| total | 47970 tonnes CO₂ | 690 kg·CO₂/n.mile | 100% |
| 2019 yearly statistics | |
|---|---|
| distance travelled | 128705 km ⚙️ |
| time at sea | 5155 hours |
| 2019 average statistics per journey | |
|---|---|
| average persons transported 🙎♀️ | 407 persons ⚙️ |
| average freight transported 🚛 | 1611 metric tons ⚙️ |
| average speed | 25 km/h ⚙️ |
2019 monitoring methods:
N/A
2019 Theoretical
EIV (Efficiency Indicator Values): 24.15 gCO₂/ton/nautical mile
﹖ details
| 2018 yearly CO₂ Emissions | |||
|---|---|---|---|
| assigned to | total | average | ratio |
| persons 🙎♀️ | 7818 tonnes CO₂ | 258 g·CO₂/pax/n.mile | 15 % ⚙️ |
| freight 🚛 | 44300 tonnes CO₂ | 386 kg·CO₂/m tonne/n.mile | 85 % ⚙️ |
| total | 52118 tonnes CO₂ | 648 kg·CO₂/n.mile | 100% |
| 2018 yearly statistics | |
|---|---|
| distance travelled | 149009 km ⚙️ |
| time at sea | 5204 hours |
| 2018 average statistics per journey | |
|---|---|
| average persons transported 🙎♀️ | 376 persons ⚙️ |
| average freight transported 🚛 | 1428 metric tons ⚙️ |
| average speed | 29 km/h ⚙️ |
2018 monitoring methods:
N/A
2018 Theoretical
EIV (Efficiency Indicator Values): 62.4 gCO₂/ton/nautical mile
﹖ details
ℹ️
Figures with the icon ⚙️ were computed based on the published data.
You can find computation details on
this page ↗
GreenFerries is a hobby project, all the data shown here has no official value. It is Open Source, so you can double check and modify it.

The Ecoscore compares
average CO₂ emissions per passenger per km.
‟emits like 2.1 planes” means that the ferry emits more than twice what an average plane would on the same distance for one passenger.