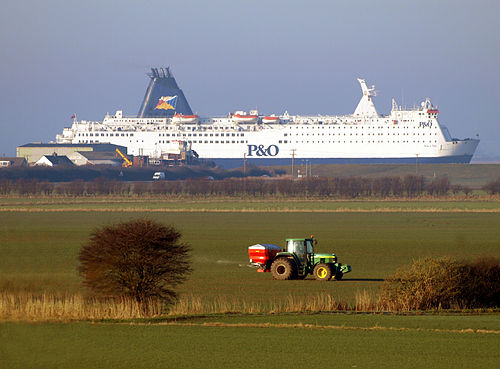
Pride of York

over 4 times an average plane's emissions
(based on 2022 data)
Often travels on 0 routes
⚠️
Do you know of a route that this ship frequently travels but is not listed? Or have you noticed an error?
Please help by letting us know, thank you 🙇🏽♀️
Please help by letting us know, thank you 🙇🏽♀️
Ship Statistics
| 2022 yearly CO₂ Emissions | |||
|---|---|---|---|
| assigned to | total | average | ratio |
| persons 🙎♀️ | 30919 tonnes CO₂ | 1321 g·CO₂/pax/n.mile | 93 % ⚙️ |
| freight 🚛 | 2327 tonnes CO₂ | 68 kg·CO₂/m tonne/n.mile | 7 % ⚙️ |
| total | 33246 tonnes CO₂ | 625 kg·CO₂/n.mile | 100% |
| 2022 yearly statistics | |
|---|---|
| distance travelled | 98527 km ⚙️ |
| time at sea | 3430 hours |
| 2022 average statistics per journey | |
|---|---|
| average persons transported 🙎♀️ | 440 persons ⚙️ |
| average freight transported 🚛 | 648 metric tons ⚙️ |
| average speed | 29 km/h ⚙️ |
2022 monitoring methods:
N/A
2022 Theoretical
EIV (Efficiency Indicator Values): 42.4 gCO₂/ton/nautical mile
﹖ details
| 2021 yearly CO₂ Emissions | |||
|---|---|---|---|
| assigned to | total | average | ratio |
| persons 🙎♀️ | 27250 tonnes CO₂ | 1063 g·CO₂/pax/n.mile | 91 % ⚙️ |
| freight 🚛 | 2695 tonnes CO₂ | 15 kg·CO₂/m tonne/n.mile | 9 % ⚙️ |
| total | 29944 tonnes CO₂ | 718 kg·CO₂/n.mile | 100% |
| 2021 yearly statistics | |
|---|---|
| distance travelled | 77266 km ⚙️ |
| time at sea | 2388 hours |
| 2021 average statistics per journey | |
|---|---|
| average persons transported 🙎♀️ | 615 persons ⚙️ |
| average freight transported 🚛 | 4199 metric tons ⚙️ |
| average speed | 32 km/h ⚙️ |
2021 monitoring methods:
N/A
2021 Theoretical
EIV (Efficiency Indicator Values): 42.4 gCO₂/ton/nautical mile
﹖ details
| 2020 yearly CO₂ Emissions | |||
|---|---|---|---|
| assigned to | total | average | ratio |
| persons 🙎♀️ | 940 tonnes CO₂ | 466 g·CO₂/pax/n.mile | 15 % ⚙️ |
| freight 🚛 | 5328 tonnes CO₂ | 219 kg·CO₂/m tonne/n.mile | 85 % ⚙️ |
| total | 6268 tonnes CO₂ | 573 kg·CO₂/n.mile | 100% |
| 2020 yearly statistics | |
|---|---|
| distance travelled | 20253 km ⚙️ |
| time at sea | 756 hours |
| 2020 average statistics per journey | |
|---|---|
| average persons transported 🙎♀️ | 185 persons ⚙️ |
| average freight transported 🚛 | 2225 metric tons ⚙️ |
| average speed | 27 km/h ⚙️ |
2020 monitoring methods:
N/A
2020 Theoretical
EIV (Efficiency Indicator Values): 35.31 gCO₂/ton/nautical mile
﹖ details
| 2019 yearly CO₂ Emissions | |||
|---|---|---|---|
| assigned to | total | average | ratio |
| persons 🙎♀️ | 5555 tonnes CO₂ | 184 g·CO₂/pax/n.mile | 15 % ⚙️ |
| freight 🚛 | 31480 tonnes CO₂ | 206 kg·CO₂/m tonne/n.mile | 85 % ⚙️ |
| total | 37035 tonnes CO₂ | 522 kg·CO₂/n.mile | 100% |
| 2019 yearly statistics | |
|---|---|
| distance travelled | 131357 km ⚙️ |
| time at sea | 4960 hours |
| 2019 average statistics per journey | |
|---|---|
| average persons transported 🙎♀️ | 425 persons ⚙️ |
| average freight transported 🚛 | 2156 metric tons ⚙️ |
| average speed | 26 km/h ⚙️ |
2019 monitoring methods:
N/A
2019 Theoretical
EIV (Efficiency Indicator Values): 35.35 gCO₂/ton/nautical mile
﹖ details
| 2018 yearly CO₂ Emissions | |||
|---|---|---|---|
| assigned to | total | average | ratio |
| persons 🙎♀️ | 5561 tonnes CO₂ | 176 g·CO₂/pax/n.mile | 15 % ⚙️ |
| freight 🚛 | 31510 tonnes CO₂ | 207 kg·CO₂/m tonne/n.mile | 85 % ⚙️ |
| total | 37070 tonnes CO₂ | 527 kg·CO₂/n.mile | 100% |
| 2018 yearly statistics | |
|---|---|
| distance travelled | 130311 km ⚙️ |
| time at sea | 6788 hours |
| 2018 average statistics per journey | |
|---|---|
| average persons transported 🙎♀️ | 449 persons ⚙️ |
| average freight transported 🚛 | 2163 metric tons ⚙️ |
| average speed | 19 km/h ⚙️ |
2018 monitoring methods:
N/A
2018 Theoretical
N/A
﹖ details
ℹ️
Figures with the icon ⚙️ were computed based on the published data.
You can find computation details on
this page ↗
GreenFerries is a hobby project, all the data shown here has no official value. It is Open Source, so you can double check and modify it.

The Ecoscore compares
average CO₂ emissions per passenger per km.
‟emits like 2.1 planes” means that the ferry emits more than twice what an average plane would on the same distance for one passenger.