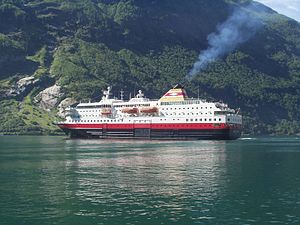
Richard With

2 to 4 times an average plane's emissions
(based on 2022 data)
Often travels on 0 routes
⚠️
Do you know of a route that this ship frequently travels but is not listed? Or have you noticed an error?
Please help by letting us know, thank you 🙇🏽♀️
Please help by letting us know, thank you 🙇🏽♀️
Ship Statistics
| 2022 yearly CO₂ Emissions | |||
|---|---|---|---|
| assigned to | total | average | ratio |
| persons 🙎♀️ | 6717 tonnes CO₂ | 1038 g·CO₂/pax/n.mile | 89 % ⚙️ |
| freight 🚛 | 830 tonnes CO₂ | 774 kg·CO₂/m tonne/n.mile | 11 % ⚙️ |
| total | 7547 tonnes CO₂ | 239 kg·CO₂/n.mile | 100% |
| 2022 yearly statistics | |
|---|---|
| distance travelled | 58449 km ⚙️ |
| time at sea | 2470 hours |
| 2022 average statistics per journey | |
|---|---|
| average persons transported 🙎♀️ | 205 persons ⚙️ |
| average freight transported 🚛 | 34 metric tons ⚙️ |
| average speed | 24 km/h ⚙️ |
2022 monitoring methods:
N/A
2022 Theoretical
EIV (Efficiency Indicator Values): 58 gCO₂/ton/nautical mile
﹖ details
| 2021 yearly CO₂ Emissions | |||
|---|---|---|---|
| assigned to | total | average | ratio |
| persons 🙎♀️ | 12342 tonnes CO₂ | 1204 g·CO₂/pax/n.mile | 89 % ⚙️ |
| freight 🚛 | 1525 tonnes CO₂ | 373 kg·CO₂/m tonne/n.mile | 11 % ⚙️ |
| total | 13867 tonnes CO₂ | 161 kg·CO₂/n.mile | 100% |
| 2021 yearly statistics | |
|---|---|
| distance travelled | 159910 km ⚙️ |
| time at sea | 6671 hours |
| 2021 average statistics per journey | |
|---|---|
| average persons transported 🙎♀️ | 119 persons ⚙️ |
| average freight transported 🚛 | 47 metric tons ⚙️ |
| average speed | 24 km/h ⚙️ |
2021 monitoring methods:
N/A
2021 Theoretical
EIV (Efficiency Indicator Values): 71.9 gCO₂/ton/nautical mile
﹖ details
| 2020 yearly CO₂ Emissions | |||
|---|---|---|---|
| assigned to | total | average | ratio |
| persons 🙎♀️ | 13188 tonnes CO₂ | 1293 g·CO₂/pax/n.mile | 89 % ⚙️ |
| freight 🚛 | 1630 tonnes CO₂ | 621 kg·CO₂/m tonne/n.mile | 11 % ⚙️ |
| total | 14818 tonnes CO₂ | 239 kg·CO₂/n.mile | 100% |
| 2020 yearly statistics | |
|---|---|
| distance travelled | 115030 km ⚙️ |
| time at sea | 5077 hours |
| 2020 average statistics per journey | |
|---|---|
| average persons transported 🙎♀️ | 164 persons ⚙️ |
| average freight transported 🚛 | 42 metric tons ⚙️ |
| average speed | 23 km/h ⚙️ |
2020 monitoring methods:
N/A
2020 Theoretical
EIV (Efficiency Indicator Values): 67.67 gCO₂/ton/nautical mile
﹖ details
| 2019 yearly CO₂ Emissions | |||
|---|---|---|---|
| assigned to | total | average | ratio |
| persons 🙎♀️ | 18980 tonnes CO₂ | 668 g·CO₂/pax/n.mile | 89 % ⚙️ |
| freight 🚛 | 2346 tonnes CO₂ | 265 kg·CO₂/m tonne/n.mile | 11 % ⚙️ |
| total | 21326 tonnes CO₂ | 238 kg·CO₂/n.mile | 100% |
| 2019 yearly statistics | |
|---|---|
| distance travelled | 166230 km ⚙️ |
| time at sea | 6691 hours |
| 2019 average statistics per journey | |
|---|---|
| average persons transported 🙎♀️ | 316 persons ⚙️ |
| average freight transported 🚛 | 99 metric tons ⚙️ |
| average speed | 25 km/h ⚙️ |
2019 monitoring methods:
N/A
2019 Theoretical
EIV (Efficiency Indicator Values): 88.9 gCO₂/ton/nautical mile
﹖ details
| 2018 yearly CO₂ Emissions | |||
|---|---|---|---|
| assigned to | total | average | ratio |
| persons 🙎♀️ | 17758 tonnes CO₂ | 719 g·CO₂/pax/n.mile | 89 % ⚙️ |
| freight 🚛 | 2195 tonnes CO₂ | 926 kg·CO₂/m tonne/n.mile | 11 % ⚙️ |
| total | 19953 tonnes CO₂ | 243 kg·CO₂/n.mile | 100% |
| 2018 yearly statistics | |
|---|---|
| distance travelled | 151880 km ⚙️ |
| time at sea | 6292 hours |
| 2018 average statistics per journey | |
|---|---|
| average persons transported 🙎♀️ | 301 persons ⚙️ |
| average freight transported 🚛 | 29 metric tons ⚙️ |
| average speed | 24 km/h ⚙️ |
2018 monitoring methods:
N/A
2018 Theoretical
N/A
﹖ details
ℹ️
Figures with the icon ⚙️ were computed based on the published data.
You can find computation details on
this page ↗
GreenFerries is a hobby project, all the data shown here has no official value. It is Open Source, so you can double check and modify it.

The Ecoscore compares
average CO₂ emissions per passenger per km.
‟emits like 2.1 planes” means that the ferry emits more than twice what an average plane would on the same distance for one passenger.