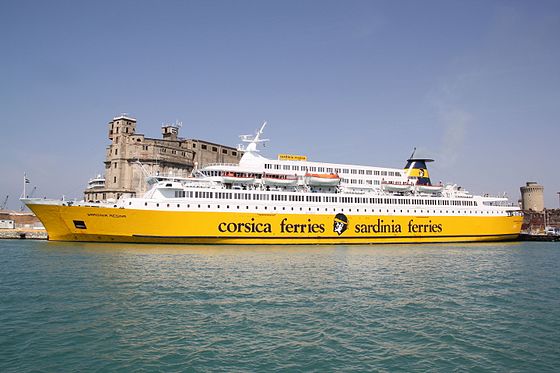
Sardinia Regina

better than riding a car with two passengers
(based on 2020 data)
Often travels on 2 routes
- Livorno [IT] ↔ Bastia [FR] - 117 km
- Savona [IT] ↔ Bastia [FR] - 192 km
⚠️
Do you know of a route that this ship frequently travels but is not listed? Or have you noticed an error?
Please help by letting us know, thank you 🙇🏽♀️
Please help by letting us know, thank you 🙇🏽♀️
Ship Statistics
| 2022 yearly CO₂ Emissions | |||
|---|---|---|---|
| assigned to | total | average | ratio |
| persons 🙎♀️ | N/A | N/A | N/A |
| freight 🚛 | N/A | N/A | N/A |
| total | N/A | N/A | 100% |
| 2022 yearly statistics | |
|---|---|
| distance travelled | N/A |
| time at sea | N/A |
| 2022 average statistics per journey | |
|---|---|
| average persons transported 🙎♀️ | N/A |
| average freight transported 🚛 | N/A |
| average speed | N/A |
2022 monitoring methods:
N/A
2022 Theoretical
N/A
﹖ details
| 2021 yearly CO₂ Emissions | |||
|---|---|---|---|
| assigned to | total | average | ratio |
| persons 🙎♀️ | N/A | N/A | N/A |
| freight 🚛 | N/A | N/A | N/A |
| total | N/A | N/A | 100% |
| 2021 yearly statistics | |
|---|---|
| distance travelled | N/A |
| time at sea | N/A |
| 2021 average statistics per journey | |
|---|---|
| average persons transported 🙎♀️ | N/A |
| average freight transported 🚛 | N/A |
| average speed | N/A |
2021 monitoring methods:
N/A
2021 Theoretical
N/A
﹖ details
| 2020 yearly CO₂ Emissions | |||
|---|---|---|---|
| assigned to | total | average | ratio |
| persons 🙎♀️ | 749 tonnes CO₂ | 72 g·CO₂/pax/n.mile | 5 % ⚙️ |
| freight 🚛 | 14230 tonnes CO₂ | 860 kg·CO₂/m tonne/n.mile | 95 % ⚙️ |
| total | 14979 tonnes CO₂ | 390 kg·CO₂/n.mile | 100% |
| 2020 yearly statistics | |
|---|---|
| distance travelled | 71099 km ⚙️ |
| time at sea | 2715 hours |
| 2020 average statistics per journey | |
|---|---|
| average persons transported 🙎♀️ | 273 persons ⚙️ |
| average freight transported 🚛 | 431 metric tons ⚙️ |
| average speed | 26 km/h ⚙️ |
2020 monitoring methods:
N/A
2020 Theoretical
EIV (Efficiency Indicator Values): 10.78 gCO₂/ton/nautical mile
﹖ details
| 2019 yearly CO₂ Emissions | |||
|---|---|---|---|
| assigned to | total | average | ratio |
| persons 🙎♀️ | 1574 tonnes CO₂ | 67 g·CO₂/pax/n.mile | 7 % ⚙️ |
| freight 🚛 | 20914 tonnes CO₂ | 866 kg·CO₂/m tonne/n.mile | 93 % ⚙️ |
| total | 22488 tonnes CO₂ | 358 kg·CO₂/n.mile | 100% |
| 2019 yearly statistics | |
|---|---|
| distance travelled | 116324 km ⚙️ |
| time at sea | 4259 hours |
| 2019 average statistics per journey | |
|---|---|
| average persons transported 🙎♀️ | 377 persons ⚙️ |
| average freight transported 🚛 | 385 metric tons ⚙️ |
| average speed | 27 km/h ⚙️ |
2019 monitoring methods:
N/A
2019 Theoretical
EIV (Efficiency Indicator Values): 10.78 gCO₂/ton/nautical mile
﹖ details
| 2018 yearly CO₂ Emissions | |||
|---|---|---|---|
| assigned to | total | average | ratio |
| persons 🙎♀️ | 1643 tonnes CO₂ | 79 g·CO₂/pax/n.mile | 9 % ⚙️ |
| freight 🚛 | 16609 tonnes CO₂ | 1030 kg·CO₂/m tonne/n.mile | 91 % ⚙️ |
| total | 18252 tonnes CO₂ | 360 kg·CO₂/n.mile | 100% |
| 2018 yearly statistics | |
|---|---|
| distance travelled | 93819 km ⚙️ |
| time at sea | 3317 hours |
| 2018 average statistics per journey | |
|---|---|
| average persons transported 🙎♀️ | 413 persons ⚙️ |
| average freight transported 🚛 | 318 metric tons ⚙️ |
| average speed | 28 km/h ⚙️ |
2018 monitoring methods:
N/A
2018 Theoretical
EIV (Efficiency Indicator Values): 10.78 gCO₂/ton/nautical mile
﹖ details
ℹ️
Figures with the icon ⚙️ were computed based on the published data.
You can find computation details on
this page ↗
GreenFerries is a hobby project, all the data shown here has no official value. It is Open Source, so you can double check and modify it.

The Ecoscore compares
average CO₂ emissions per passenger per km.
‟emits like 2.1 planes” means that the ferry emits more than twice what an average plane would on the same distance for one passenger.