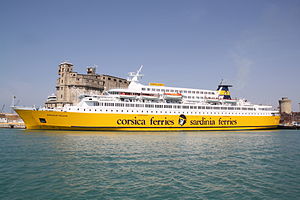
Sardinia Vera

better than riding a car with two passengers
(based on 2022 data)
Often travels on 1 routes
- Nice [FR] ↔ Île-Rousse [FR] - 178 km
⚠️
Do you know of a route that this ship frequently travels but is not listed? Or have you noticed an error?
Please help by letting us know, thank you 🙇🏽♀️
Please help by letting us know, thank you 🙇🏽♀️
Ship Statistics
| 2022 yearly CO₂ Emissions | |||
|---|---|---|---|
| assigned to | total | average | ratio |
| persons 🙎♀️ | 494 tonnes CO₂ | 55 g·CO₂/pax/n.mile | 5 % ⚙️ |
| freight 🚛 | 6355 tonnes CO₂ | 666 kg·CO₂/m tonne/n.mile | 95 % ⚙️ |
| total | 9228 tonnes CO₂ | 348 kg·CO₂/n.mile | 100% |
| 2022 yearly statistics | |
|---|---|
| distance travelled | 49161 km ⚙️ |
| time at sea | 2198 hours |
| 2022 average statistics per journey | |
|---|---|
| average persons transported 🙎♀️ | 339 persons ⚙️ |
| average freight transported 🚛 | 360 metric tons ⚙️ |
| average speed | 22 km/h ⚙️ |
2022 monitoring methods:
N/A
2022 Theoretical
EIV (Efficiency Indicator Values): 10.78 gCO₂/ton/nautical mile
﹖ details
| 2021 yearly CO₂ Emissions | |||
|---|---|---|---|
| assigned to | total | average | ratio |
| persons 🙎♀️ | 23 tonnes CO₂ | 95 g·CO₂/pax/n.mile | 0.2716472230293965 % ⚙️ |
| freight 🚛 | 4377 tonnes CO₂ | 758 kg·CO₂/m tonne/n.mile | 100 % ⚙️ |
| total | 8397 tonnes CO₂ | 362 kg·CO₂/n.mile | 100% |
| 2021 yearly statistics | |
|---|---|
| distance travelled | 43018 km ⚙️ |
| time at sea | 1771 hours |
| 2021 average statistics per journey | |
|---|---|
| average persons transported 🙎♀️ | 10 persons ⚙️ |
| average freight transported 🚛 | 248 metric tons ⚙️ |
| average speed | 24 km/h ⚙️ |
2021 monitoring methods:
N/A
2021 Theoretical
EIV (Efficiency Indicator Values): 10.78 gCO₂/ton/nautical mile
﹖ details
| 2020 yearly CO₂ Emissions | |||
|---|---|---|---|
| assigned to | total | average | ratio |
| persons 🙎♀️ | 26 tonnes CO₂ | 112 g·CO₂/pax/n.mile | 1 % ⚙️ |
| freight 🚛 | 2600 tonnes CO₂ | 800 kg·CO₂/m tonne/n.mile | 99 % ⚙️ |
| total | 2626 tonnes CO₂ | 354 kg·CO₂/n.mile | 100% |
| 2020 yearly statistics | |
|---|---|
| distance travelled | 13756 km ⚙️ |
| time at sea | 650 hours |
| 2020 average statistics per journey | |
|---|---|
| average persons transported 🙎♀️ | 32 persons ⚙️ |
| average freight transported 🚛 | 437 metric tons ⚙️ |
| average speed | 21 km/h ⚙️ |
2020 monitoring methods:
N/A
2020 Theoretical
EIV (Efficiency Indicator Values): 10.78 gCO₂/ton/nautical mile
﹖ details
| 2019 yearly CO₂ Emissions | |||
|---|---|---|---|
| assigned to | total | average | ratio |
| persons 🙎♀️ | 866 tonnes CO₂ | 99 g·CO₂/pax/n.mile | 13 % ⚙️ |
| freight 🚛 | 5797 tonnes CO₂ | 975 kg·CO₂/m tonne/n.mile | 87 % ⚙️ |
| total | 6663 tonnes CO₂ | 373 kg·CO₂/n.mile | 100% |
| 2019 yearly statistics | |
|---|---|
| distance travelled | 33040 km ⚙️ |
| time at sea | 1289 hours |
| 2019 average statistics per journey | |
|---|---|
| average persons transported 🙎♀️ | 492 persons ⚙️ |
| average freight transported 🚛 | 333 metric tons ⚙️ |
| average speed | 26 km/h ⚙️ |
2019 monitoring methods:
N/A
2019 Theoretical
EIV (Efficiency Indicator Values): 10.78 gCO₂/ton/nautical mile
﹖ details
| 2018 yearly CO₂ Emissions | |||
|---|---|---|---|
| assigned to | total | average | ratio |
| persons 🙎♀️ | 1387 tonnes CO₂ | 126 g·CO₂/pax/n.mile | 13 % ⚙️ |
| freight 🚛 | 9282 tonnes CO₂ | 1235 kg·CO₂/m tonne/n.mile | 87 % ⚙️ |
| total | 10669 tonnes CO₂ | 390 kg·CO₂/n.mile | 100% |
| 2018 yearly statistics | |
|---|---|
| distance travelled | 50634 km ⚙️ |
| time at sea | 1903 hours |
| 2018 average statistics per journey | |
|---|---|
| average persons transported 🙎♀️ | 403 persons ⚙️ |
| average freight transported 🚛 | 275 metric tons ⚙️ |
| average speed | 27 km/h ⚙️ |
2018 monitoring methods:
N/A
2018 Theoretical
EIV (Efficiency Indicator Values): 10.78 gCO₂/ton/nautical mile
﹖ details
ℹ️
Figures with the icon ⚙️ were computed based on the published data.
You can find computation details on
this page ↗
GreenFerries is a hobby project, all the data shown here has no official value. It is Open Source, so you can double check and modify it.

The Ecoscore compares
average CO₂ emissions per passenger per km.
‟emits like 2.1 planes” means that the ferry emits more than twice what an average plane would on the same distance for one passenger.