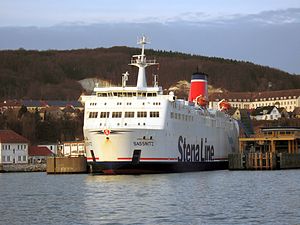
Sassnitz

over 4 times an average plane's emissions
(based on 2020 data)
Often travels on 1 routes
- Sassnitz [DE] ↔ Trelleborg [SE] - 100 km
⚠️
Do you know of a route that this ship frequently travels but is not listed? Or have you noticed an error?
Please help by letting us know, thank you 🙇🏽♀️
Please help by letting us know, thank you 🙇🏽♀️
Ship Statistics
| 2022 yearly CO₂ Emissions | |||
|---|---|---|---|
| assigned to | total | average | ratio |
| persons 🙎♀️ | N/A | N/A | N/A |
| freight 🚛 | N/A | N/A | N/A |
| total | N/A | N/A | 100% |
| 2022 yearly statistics | |
|---|---|
| distance travelled | N/A |
| time at sea | N/A |
| 2022 average statistics per journey | |
|---|---|
| average persons transported 🙎♀️ | N/A |
| average freight transported 🚛 | N/A |
| average speed | N/A |
2022 monitoring methods:
N/A
2022 Theoretical
N/A
﹖ details
| 2021 yearly CO₂ Emissions | |||
|---|---|---|---|
| assigned to | total | average | ratio |
| persons 🙎♀️ | N/A | N/A | N/A |
| freight 🚛 | N/A | N/A | N/A |
| total | N/A | N/A | 100% |
| 2021 yearly statistics | |
|---|---|
| distance travelled | N/A |
| time at sea | N/A |
| 2021 average statistics per journey | |
|---|---|
| average persons transported 🙎♀️ | N/A |
| average freight transported 🚛 | N/A |
| average speed | N/A |
2021 monitoring methods:
N/A
2021 Theoretical
N/A
﹖ details
| 2020 yearly CO₂ Emissions | |||
|---|---|---|---|
| assigned to | total | average | ratio |
| persons 🙎♀️ | 2904 tonnes CO₂ | 2132 g·CO₂/pax/n.mile | 63 % ⚙️ |
| freight 🚛 | 1706 tonnes CO₂ | 274 kg·CO₂/m tonne/n.mile | 37 % ⚙️ |
| total | 4610 tonnes CO₂ | 392 kg·CO₂/n.mile | 100% |
| 2020 yearly statistics | |
|---|---|
| distance travelled | 21788 km ⚙️ |
| time at sea | 867 hours |
| 2020 average statistics per journey | |
|---|---|
| average persons transported 🙎♀️ | 116 persons ⚙️ |
| average freight transported 🚛 | 529 metric tons ⚙️ |
| average speed | 25 km/h ⚙️ |
2020 monitoring methods:
N/A
2020 Theoretical
EIV (Efficiency Indicator Values): 66.3 gCO₂/ton/nautical mile
﹖ details
| 2019 yearly CO₂ Emissions | |||
|---|---|---|---|
| assigned to | total | average | ratio |
| persons 🙎♀️ | 16152 tonnes CO₂ | 873 g·CO₂/pax/n.mile | 69 % ⚙️ |
| freight 🚛 | 4171 tonnes CO₂ | 153 kg·CO₂/m tonne/n.mile | 31 % ⚙️ |
| total | 23341 tonnes CO₂ | 376 kg·CO₂/n.mile | 100% |
| 2019 yearly statistics | |
|---|---|
| distance travelled | 114851 km ⚙️ |
| time at sea | 4595 hours |
| 2019 average statistics per journey | |
|---|---|
| average persons transported 🙎♀️ | 298 persons ⚙️ |
| average freight transported 🚛 | 440 metric tons ⚙️ |
| average speed | 25 km/h ⚙️ |
2019 monitoring methods:
N/A
2019 Theoretical
N/A
﹖ details
| 2018 yearly CO₂ Emissions | |||
|---|---|---|---|
| assigned to | total | average | ratio |
| persons 🙎♀️ | 20808 tonnes CO₂ | 1155 g·CO₂/pax/n.mile | 89 % ⚙️ |
| freight 🚛 | 2648 tonnes CO₂ | 198 kg·CO₂/m tonne/n.mile | 11 % ⚙️ |
| total | 23456 tonnes CO₂ | 405 kg·CO₂/n.mile | 100% |
| 2018 yearly statistics | |
|---|---|
| distance travelled | 107326 km ⚙️ |
| time at sea | 4273 hours |
| 2018 average statistics per journey | |
|---|---|
| average persons transported 🙎♀️ | 311 persons ⚙️ |
| average freight transported 🚛 | 230 metric tons ⚙️ |
| average speed | 25 km/h ⚙️ |
2018 monitoring methods:
N/A
2018 Theoretical
N/A
﹖ details
ℹ️
Figures with the icon ⚙️ were computed based on the published data.
You can find computation details on
this page ↗
GreenFerries is a hobby project, all the data shown here has no official value. It is Open Source, so you can double check and modify it.

The Ecoscore compares
average CO₂ emissions per passenger per km.
‟emits like 2.1 planes” means that the ferry emits more than twice what an average plane would on the same distance for one passenger.