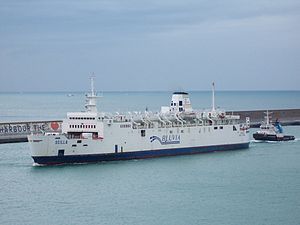
Scilla

better than riding a car with two passengers
(based on 2022 data)
Often travels on 1 routes
⚠️
Do you know of a route that this ship frequently travels but is not listed? Or have you noticed an error?
Please help by letting us know, thank you 🙇🏽♀️
Please help by letting us know, thank you 🙇🏽♀️
Ship Statistics
| 2022 yearly CO₂ Emissions | |||
|---|---|---|---|
| assigned to | total | average | ratio |
| persons 🙎♀️ | 3124 tonnes CO₂ | 7 g·CO₂/pax/n.mile | 44 % ⚙️ |
| freight 🚛 | 3976 tonnes CO₂ | 1 kg·CO₂/m tonne/n.mile | 56 % ⚙️ |
| total | 7099 tonnes CO₂ | 807 kg·CO₂/n.mile | 100% |
| 2022 yearly statistics | |
|---|---|
| distance travelled | 16301 km ⚙️ |
| time at sea | 1081 hours |
| 2022 average statistics per journey | |
|---|---|
| average persons transported 🙎♀️ | 50625 persons ⚙️ |
| average freight transported 🚛 | 392755 metric tons ⚙️ |
| average speed | 15 km/h ⚙️ |
2022 monitoring methods:
N/A
2022 Theoretical
EIV (Efficiency Indicator Values): 123 gCO₂/ton/nautical mile
﹖ details
| 2021 yearly CO₂ Emissions | |||
|---|---|---|---|
| assigned to | total | average | ratio |
| persons 🙎♀️ | 3191 tonnes CO₂ | 4 g·CO₂/pax/n.mile | 45 % ⚙️ |
| freight 🚛 | 3900 tonnes CO₂ | 0.77 kg·CO₂/m tonne/n.mile | 55 % ⚙️ |
| total | 7091 tonnes CO₂ | 650 kg·CO₂/n.mile | 100% |
| 2021 yearly statistics | |
|---|---|
| distance travelled | 20200 km ⚙️ |
| time at sea | 1339 hours |
| 2021 average statistics per journey | |
|---|---|
| average persons transported 🙎♀️ | 66643 persons ⚙️ |
| average freight transported 🚛 | 464386 metric tons ⚙️ |
| average speed | 15 km/h ⚙️ |
2021 monitoring methods:
N/A
2021 Theoretical
EIV (Efficiency Indicator Values): 123 gCO₂/ton/nautical mile
﹖ details
| 2020 yearly CO₂ Emissions | |||
|---|---|---|---|
| assigned to | total | average | ratio |
| persons 🙎♀️ | 1693 tonnes CO₂ | 24 g·CO₂/pax/n.mile | 45 % ⚙️ |
| freight 🚛 | 2071 tonnes CO₂ | 4 kg·CO₂/m tonne/n.mile | 55 % ⚙️ |
| total | 3764 tonnes CO₂ | 868 kg·CO₂/n.mile | 100% |
| 2020 yearly statistics | |
|---|---|
| distance travelled | 8032 km ⚙️ |
| time at sea | 533 hours |
| 2020 average statistics per journey | |
|---|---|
| average persons transported 🙎♀️ | 16504 persons ⚙️ |
| average freight transported 🚛 | 129766 metric tons ⚙️ |
| average speed | 15 km/h ⚙️ |
2020 monitoring methods:
N/A
2020 Theoretical
EIV (Efficiency Indicator Values): 123 gCO₂/ton/nautical mile
﹖ details
| 2019 yearly CO₂ Emissions | |||
|---|---|---|---|
| assigned to | total | average | ratio |
| persons 🙎♀️ | 5317 tonnes CO₂ | 3 g·CO₂/pax/n.mile | 66 % ⚙️ |
| freight 🚛 | 2739 tonnes CO₂ | 1 kg·CO₂/m tonne/n.mile | 34 % ⚙️ |
| total | 8056 tonnes CO₂ | 660 kg·CO₂/n.mile | 100% |
| 2019 yearly statistics | |
|---|---|
| distance travelled | 22591 km ⚙️ |
| time at sea | 1498 hours |
| 2019 average statistics per journey | |
|---|---|
| average persons transported 🙎♀️ | 141977 persons ⚙️ |
| average freight transported 🚛 | 218000 metric tons ⚙️ |
| average speed | 15 km/h ⚙️ |
2019 monitoring methods:
N/A
2019 Theoretical
EIV (Efficiency Indicator Values): 123 gCO₂/ton/nautical mile
﹖ details
| 2018 yearly CO₂ Emissions | |||
|---|---|---|---|
| assigned to | total | average | ratio |
| persons 🙎♀️ | 9326 tonnes CO₂ | 10563 g·CO₂/pax/n.mile | 100 % ⚙️ |
| freight 🚛 | 9326 tonnes CO₂ | 17905 kg·CO₂/m tonne/n.mile | N/A |
| total | 9326 tonnes CO₂ | 556 kg·CO₂/n.mile | 100% |
| 2018 yearly statistics | |
|---|---|
| distance travelled | 31063 km ⚙️ |
| time at sea | 2059 hours |
| 2018 average statistics per journey | |
|---|---|
| average persons transported 🙎♀️ | 53 persons ⚙️ |
| average freight transported 🚛 | 31 metric tons ⚙️ |
| average speed | 15 km/h ⚙️ |
2018 monitoring methods:
N/A
2018 Theoretical
EIV (Efficiency Indicator Values): 123 gCO₂/ton/nautical mile
﹖ details
ℹ️
Figures with the icon ⚙️ were computed based on the published data.
You can find computation details on
this page ↗
GreenFerries is a hobby project, all the data shown here has no official value. It is Open Source, so you can double check and modify it.

The Ecoscore compares
average CO₂ emissions per passenger per km.
‟emits like 2.1 planes” means that the ferry emits more than twice what an average plane would on the same distance for one passenger.