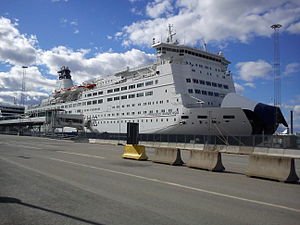
SPL Princess Anastasia

better than riding a car with a single passenger
(based on 2019 data)
Often travels on 5 routes
- Helsinki [FI] ↔ Stockholm [SE] - 396 km
- Helsinki [FI] ↔ Tallinn [EE] - 82 km
- St Petersburg [RU] ↔ Helsinki [FI] - 299 km
- St Petersburg [RU] ↔ Stockholm [SE] - 691 km
- Tallinn [EE] ↔ Stockholm [SE] - 378 km
⚠️
Do you know of a route that this ship frequently travels but is not listed? Or have you noticed an error?
Please help by letting us know, thank you 🙇🏽♀️
Please help by letting us know, thank you 🙇🏽♀️
Ship Statistics
| 2022 yearly CO₂ Emissions | |||
|---|---|---|---|
| assigned to | total | average | ratio |
| persons 🙎♀️ | N/A | N/A | N/A |
| freight 🚛 | N/A | N/A | N/A |
| total | N/A | N/A | 100% |
| 2022 yearly statistics | |
|---|---|
| distance travelled | N/A |
| time at sea | N/A |
| 2022 average statistics per journey | |
|---|---|
| average persons transported 🙎♀️ | N/A |
| average freight transported 🚛 | N/A |
| average speed | N/A |
2022 monitoring methods:
N/A
2022 Theoretical
N/A
﹖ details
| 2021 yearly CO₂ Emissions | |||
|---|---|---|---|
| assigned to | total | average | ratio |
| persons 🙎♀️ | N/A | N/A | N/A |
| freight 🚛 | N/A | N/A | N/A |
| total | N/A | N/A | 100% |
| 2021 yearly statistics | |
|---|---|
| distance travelled | N/A |
| time at sea | N/A |
| 2021 average statistics per journey | |
|---|---|
| average persons transported 🙎♀️ | N/A |
| average freight transported 🚛 | N/A |
| average speed | N/A |
2021 monitoring methods:
N/A
2021 Theoretical
N/A
﹖ details
| 2020 yearly CO₂ Emissions | |||
|---|---|---|---|
| assigned to | total | average | ratio |
| persons 🙎♀️ | N/A | N/A | N/A |
| freight 🚛 | N/A | N/A | N/A |
| total | N/A | N/A | 100% |
| 2020 yearly statistics | |
|---|---|
| distance travelled | N/A |
| time at sea | N/A |
| 2020 average statistics per journey | |
|---|---|
| average persons transported 🙎♀️ | N/A |
| average freight transported 🚛 | N/A |
| average speed | N/A |
2020 monitoring methods:
N/A
2020 Theoretical
N/A
﹖ details
| 2019 yearly CO₂ Emissions | |||
|---|---|---|---|
| assigned to | total | average | ratio |
| persons 🙎♀️ | 20606 tonnes CO₂ | 351 g·CO₂/pax/n.mile | 82 % ⚙️ |
| freight 🚛 | 4647 tonnes CO₂ | 163 kg·CO₂/m tonne/n.mile | 18 % ⚙️ |
| total | 25253 tonnes CO₂ | 514 kg·CO₂/n.mile | 100% |
| 2019 yearly statistics | |
|---|---|
| distance travelled | 91048 km ⚙️ |
| time at sea | 3599 hours |
| 2019 average statistics per journey | |
|---|---|
| average persons transported 🙎♀️ | 1195 persons ⚙️ |
| average freight transported 🚛 | 580 metric tons ⚙️ |
| average speed | 25 km/h ⚙️ |
2019 monitoring methods:
N/A
2019 Theoretical
EIV (Efficiency Indicator Values): 3.76 gCO₂/ton/nautical mile
﹖ details
| 2018 yearly CO₂ Emissions | |||
|---|---|---|---|
| assigned to | total | average | ratio |
| persons 🙎♀️ | 25527 tonnes CO₂ | 386 g·CO₂/pax/n.mile | 82 % ⚙️ |
| freight 🚛 | 5756 tonnes CO₂ | 164 kg·CO₂/m tonne/n.mile | 18 % ⚙️ |
| total | 31283 tonnes CO₂ | 535 kg·CO₂/n.mile | 100% |
| 2018 yearly statistics | |
|---|---|
| distance travelled | 108357 km ⚙️ |
| time at sea | 4323 hours |
| 2018 average statistics per journey | |
|---|---|
| average persons transported 🙎♀️ | 1130 persons ⚙️ |
| average freight transported 🚛 | 598 metric tons ⚙️ |
| average speed | 25 km/h ⚙️ |
2018 monitoring methods:
N/A
2018 Theoretical
EIV (Efficiency Indicator Values): 3.76 gCO₂/ton/nautical mile
﹖ details
ℹ️
Figures with the icon ⚙️ were computed based on the published data.
You can find computation details on
this page ↗
GreenFerries is a hobby project, all the data shown here has no official value. It is Open Source, so you can double check and modify it.

The Ecoscore compares
average CO₂ emissions per passenger per km.
‟emits like 2.1 planes” means that the ferry emits more than twice what an average plane would on the same distance for one passenger.