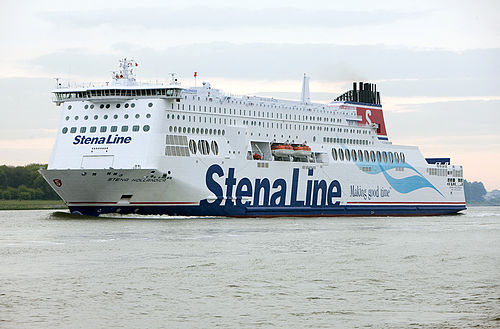
MV Stena Hollandica

2 to 4 times an average plane's emissions
(based on 2022 data)
Often travels on 0 routes
⚠️
Do you know of a route that this ship frequently travels but is not listed? Or have you noticed an error?
Please help by letting us know, thank you 🙇🏽♀️
Please help by letting us know, thank you 🙇🏽♀️
Ship Statistics
| 2022 yearly CO₂ Emissions | |||
|---|---|---|---|
| assigned to | total | average | ratio |
| persons 🙎♀️ | 25065 tonnes CO₂ | 717 g·CO₂/pax/n.mile | 42 % ⚙️ |
| freight 🚛 | 34613 tonnes CO₂ | 140 kg·CO₂/m tonne/n.mile | 58 % ⚙️ |
| total | 59678 tonnes CO₂ | 742 kg·CO₂/n.mile | 100% |
| 2022 yearly statistics | |
|---|---|
| distance travelled | 148913 km ⚙️ |
| time at sea | 5695 hours |
| 2022 average statistics per journey | |
|---|---|
| average persons transported 🙎♀️ | 435 persons ⚙️ |
| average freight transported 🚛 | 3084 metric tons ⚙️ |
| average speed | 26 km/h ⚙️ |
2022 monitoring methods:
N/A
2022 Theoretical
EIV (Efficiency Indicator Values): 21.83 gCO₂/ton/nautical mile
﹖ details
| 2021 yearly CO₂ Emissions | |||
|---|---|---|---|
| assigned to | total | average | ratio |
| persons 🙎♀️ | 28226 tonnes CO₂ | 1421 g·CO₂/pax/n.mile | 42 % ⚙️ |
| freight 🚛 | 38978 tonnes CO₂ | 127 kg·CO₂/m tonne/n.mile | 58 % ⚙️ |
| total | 67204 tonnes CO₂ | 830 kg·CO₂/n.mile | 100% |
| 2021 yearly statistics | |
|---|---|
| distance travelled | 149916 km ⚙️ |
| time at sea | 5166 hours |
| 2021 average statistics per journey | |
|---|---|
| average persons transported 🙎♀️ | 245 persons ⚙️ |
| average freight transported 🚛 | 3797 metric tons ⚙️ |
| average speed | 29 km/h ⚙️ |
2021 monitoring methods:
N/A
2021 Theoretical
EIV (Efficiency Indicator Values): 21.83 gCO₂/ton/nautical mile
﹖ details
| 2020 yearly CO₂ Emissions | |||
|---|---|---|---|
| assigned to | total | average | ratio |
| persons 🙎♀️ | 32906 tonnes CO₂ | 1977 g·CO₂/pax/n.mile | 55 % ⚙️ |
| freight 🚛 | 22587 tonnes CO₂ | 95 kg·CO₂/m tonne/n.mile | 45 % ⚙️ |
| total | 60225 tonnes CO₂ | 814 kg·CO₂/n.mile | 100% |
| 2020 yearly statistics | |
|---|---|
| distance travelled | 137026 km ⚙️ |
| time at sea | 5534 hours |
| 2020 average statistics per journey | |
|---|---|
| average persons transported 🙎♀️ | 225 persons ⚙️ |
| average freight transported 🚛 | 3220 metric tons ⚙️ |
| average speed | 25 km/h ⚙️ |
2020 monitoring methods:
N/A
2020 Theoretical
EIV (Efficiency Indicator Values): 17 gCO₂/ton/nautical mile
﹖ details
| 2019 yearly CO₂ Emissions | |||
|---|---|---|---|
| assigned to | total | average | ratio |
| persons 🙎♀️ | 35875 tonnes CO₂ | 888 g·CO₂/pax/n.mile | 57 % ⚙️ |
| freight 🚛 | 22523 tonnes CO₂ | 61 kg·CO₂/m tonne/n.mile | 43 % ⚙️ |
| total | 63010 tonnes CO₂ | 770 kg·CO₂/n.mile | 100% |
| 2019 yearly statistics | |
|---|---|
| distance travelled | 151604 km ⚙️ |
| time at sea | 5703 hours |
| 2019 average statistics per journey | |
|---|---|
| average persons transported 🙎♀️ | 493 persons ⚙️ |
| average freight transported 🚛 | 4487 metric tons ⚙️ |
| average speed | 27 km/h ⚙️ |
2019 monitoring methods:
N/A
2019 Theoretical
N/A
﹖ details
| 2018 yearly CO₂ Emissions | |||
|---|---|---|---|
| assigned to | total | average | ratio |
| persons 🙎♀️ | 44565 tonnes CO₂ | 941 g·CO₂/pax/n.mile | 66 % ⚙️ |
| freight 🚛 | 23274 tonnes CO₂ | 58 kg·CO₂/m tonne/n.mile | 34 % ⚙️ |
| total | 67839 tonnes CO₂ | 826 kg·CO₂/n.mile | 100% |
| 2018 yearly statistics | |
|---|---|
| distance travelled | 152166 km ⚙️ |
| time at sea | 5261 hours |
| 2018 average statistics per journey | |
|---|---|
| average persons transported 🙎♀️ | 576 persons ⚙️ |
| average freight transported 🚛 | 4882 metric tons ⚙️ |
| average speed | 29 km/h ⚙️ |
2018 monitoring methods:
N/A
2018 Theoretical
N/A
﹖ details
ℹ️
Figures with the icon ⚙️ were computed based on the published data.
You can find computation details on
this page ↗
GreenFerries is a hobby project, all the data shown here has no official value. It is Open Source, so you can double check and modify it.

The Ecoscore compares
average CO₂ emissions per passenger per km.
‟emits like 2.1 planes” means that the ferry emits more than twice what an average plane would on the same distance for one passenger.